저작자표시-비영리-변경금지 2.0 대한민국 이용자는 아래의 조건을 따르는 경우에 한하여 자유롭게 l 이 저작물을 복제, 배포, 전송, 전시, 공연 및 방송할 수 있습니다. 다음과 같은 조건을 따라야 합니다: l 귀하는, 이 저작물의 재이용이나 배포의 경우, 이 저작물에 적용된 이용허락조건 을 명확하게 나타내어야 합니다. l 저작권자로부터 별도의 허가를 받으면 이러한 조건들은 적용되지 않습니다. 저작권법에 따른 이용자의 권리는 위의 내용에 의하여 영향을 받지 않습니다. 이것은 이용허락규약(Legal Code)을 이해하기 쉽게 요약한 것입니다. Disclaimer 저작자표시. 귀하는 원저작자를 표시하여야 합니다. 비영리. 귀하는 이 저작물을 영리 목적으로 이용할 수 없습니다. 변경금지. 귀하는 이 저작물을 개작, 변형 또는 가공할 수 없습니다.
A doctoral thesis
Mechanism of 2-deoxy-
D
-ribose-induced
β-cell damage : The cystine/glutamate
antiporters system
c-
protects β-cell from
oxidative stress
Graduate School of Jeju National University
Department of Medicine
Soyeon Yoo
Contents Abstract
1. Introduction ... 1
1.1 Role of hyperglycemia induced oxidative stress in β-cell dysfunction in type 2 diabetes ... 1
1.2 Redox regulation ... 3
1.2.1 Glutathione system ... 4
1.2.2 The cysteine/cystine cycle and transporter ... 6
1.2.3 System c-: sodium-independent cystine/glutamate antiporter ... 8
1.3 2-deoxy- D-ribose (dRib) induced pancreatic β-cell damage ... 10
1.3.1 2-deoxy-D-ribose (dRib) ... 10
1.3.2 dRib induced oxidative stress and apoptosis in β-cell ... 11
1.4 Objectives ... 16
2. Materials and Methods ... 17
2.2 Cell cultures ... 18
2.3 Assessment of cell viability ... 18
2.4 Flow cytometry to assess apoptosis ... 19
2.5 Assessment of the intracellular levels of ROS ... 19
2.6 Determination of the intracellular levels of glutathione ... 20
2.7 Measurement of cystine transport ... 21
2.8 Cell transfection ... 22
2.9 RNA isolation and reverse transcription quantitative polymerase chain reaction (RT qPCR). ... 22
2.10 Statistical analysis. ... 23
3 Results ... 24
3.1 dRib inhibits cystine transport and decreases intracellular GSH content ... 24
3.2 2-ME prevents dRib-induced decreases in cystine transport, GSH content, and cell viability... 27
3.3 2-ME Na+-independently prevents dRib-induced decreases in cystine transport ... 31
3.4 SASP and HCA reduce cystine transport and GSH concentration, and the reductions are prevented by 2-ME ... 33
3.5 Enforced expression of xCT overcomes dRib-induced decreases in cystine transport,
GSH content, and cell viability ... 36
3.6 The enforced expression of xCT recovers the dRib-induced increase in intracellular levels of ROS and apoptosis ... 45
4. Discussion ... 55
5. Conclusion ... 57
Abstract
Pancreatic β-cells are vulnerable to oxidative stress, which is related to β-cell failure in type 2 diabetes. System c-is a sodium-independent, cystine/glutamate antiporter that mediates the
exchange of extracellular L-cystine and intracellular L-glutamate. The import of L-cystine
through this transporter is the limiting state of intracellular glutathione (GSH) synthesis that has a significant role in defending against oxidative stress. Our previous study reported that 2‑deoxy‑D‑ribose (dRib) induces oxidative damage through GSH depletion in pancreatic
β-cells. This study aims to elucidate the mechanism underlying oxidative stress-induced β-cell damage.
We measured intracellular L-[14C]cystine uptake, GSH content, reactive oxygen species
(ROS) levels, cytotoxicity, and apoptosis in the rat insulinoma cell line, RINm5F.
Stimulation with dRib dose- and time-dependently decreased intracellular L-[14C]cystine
uptake and GSH content and increased intracellular ROS levels, cytotoxicity, and apoptosis. The addition of 2-mercaptoethanol (2-ME), a cystine uptake enhancer, Na+-independently recovered the dRib-induced decreases in L-[14C]cystine uptake, GSH content, and cell
β-cell damage, we overexpressed xCT, the substrate-specific subunit of the system c-,using a
lentiviral vector in RINm5F cells. The overexpression of xCT fully recovered the dRib-induced decreases in L-[14C]cystine uptake and GSH content and prevented the dRib-induced
ROS rises, cytotoxicity, and apoptosis.
In conclusion, the overexpression of xCT showed protective effects against dRib-induced oxidative damage in RINm5F cells. This result suggests that system c-deficiency plays a
1. Introduction
1.1 Role of hyperglycemia induced oxidative stress in β-cell dysfunction in type 2 diabetes
Diabetes mellitus is a disease characterized by high blood sugar. Chronic hyperglycemia leads to retinopathy, nephropathy, neuropathy and macrovascular complications in diabetes. The pancreatic β-cell in type 2 diabetes is also affected by chronic hyperglycemia. Type 2 diabetes is heterogeneous condition of polygenic origin. Both insulin resistance and defective secretion of insulin are known to be pathogenesis of type 2 diabetes. β-cell failure in type 2 diabetes is an ongoing process, regardless of the nature of primary insulin secretion defect (1). Chronic hyperglycemia can exert deleterious effect on β-cell function, referred to as glucotoxicity. Adverse effects of chronic hyperglycemia on β-cell function can be classified into three categories: glucose desensitization, β-cell exhaustion and glucotoxicity. Glucose desensitization refers to rapid and reversible cellular refractoriness of insulin secretory function of β-cell following short exposure to hyperglycemia (2). β-Cell exhaustion refers to depletion of the pool of intracellular insulin that can be secreted immediately after prolonged exposure to high glucose. In contrast, glucotoxicity refers to progressive and irreversible effect of chronic hyperglycemia on pancreatic β-cell function and apoptosis (3).
There include glyceraldehyde autoxidation, protein kinase C activation, methylglyoxal formation and glycation, hexosamine formation, sorbitol formation, and oxidative phosphorylation. Many mechanisms have been suggested that excessive glucose metabolite cause β-cell damage through these pathways. However all these pathway have in common the formation of reactive oxygen species (Fig. 1). Chronic hyperglycemia causes excessive and sustained oxidative stress in β-cells, which in turn causes defective insulin gene expression and insulin secretion as well as increased apoptosis (4).
Fig.1. Six biochemical pathways along which glucose metabolism can form ROS (Adopted from Robertson et al (4)). DAG, diacylglycerol; PKC, protein kinase C
1.2 Redox regulation
The Cells are equipped with enzymatic and nonenzymatic antioxidant systems to remove ROS and maintenance of intracellular redox homeostasis. First class of enzymatic antioxidant is superoxide dismutase (SOD), which catalyze the dismutation of O2¯ to H2O2. H2O2 can be
converted to H2O+ O2 through the action of catalase and catalyzed by glutathione peroxidase.
Glutathione peroxidase can convert H2O2 to O2 through coupled reactions with conversion of
reduced glutathione (GSH) to oxidized glutathione (GSSG).
Nonenzymatic antioxidants, which execute thiol disulfide exchange reactions, also has important role in maintain cellular redox balance. Glutathione is major low-molecular weight thiol in living cells. It acts as a cofactor of various antioxidant enzymes, but also has direct free radical scavenging activity. The thioredoxin system is another major thiol antioxidant consisting of thioredoxin (Trx) and thioredoxin reductase (5).
1.2.1 Glutathione system
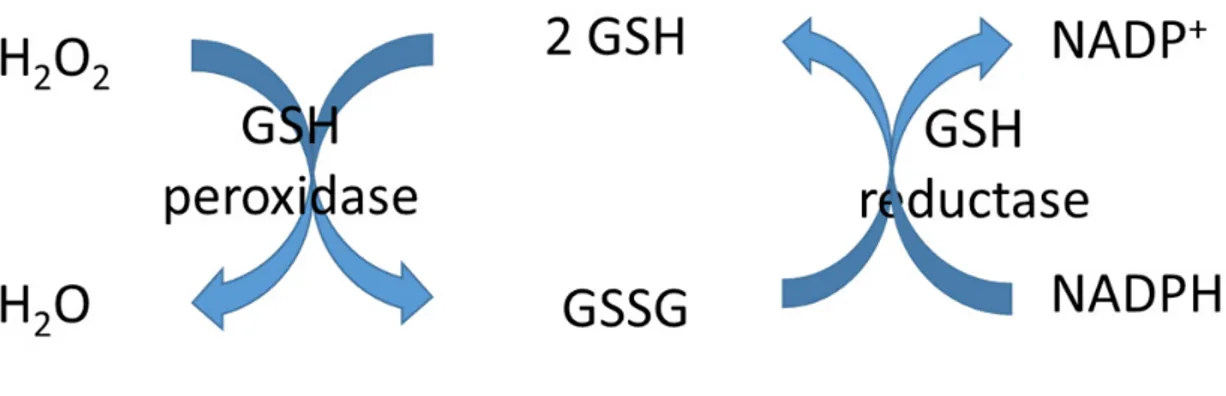
Glutathione is a tripeptide, γ-L-glutamyl-L-cysteinyl-glycine (Fig. 2). It is present in thiol-reduced (GSH) forms and disulfide-oxidized (GSSG) forms. The predominant form is GSH and existing in millimolar concentration in most of cells (6). GSH plays an important role in redox homeostasis. The hydrogen peroxide is reduced by GSH in presence of GSH peroxidase (Fig. 3). In this process, GSH is oxidized to GSSG, which is reduced back to GSH by GSSG reductase by consuming NADPH, thereby forming a redox cycle (7).
Fig. 3. GSH is an important antioxidant. Hydrogen peroxide can be metabolized by GSH peroxidase. GSSG that is formed is reduced back to GSH by GSSG reductase at the expense of NADPH, thereby forming a redox cycle.
Glutathione is synthesized by two sequential, ATP-dependent steps. The first step is the addition of cysteine to glutamate, catalyzed by γ-glutamylcysteine synthetase (γ-GCS), which is considered as rate limiting step in GSH biosynthesis. The second step is the addition of glycine, catalyzed by GSH synthase. There are two factors determining GSH synthesis, cysteine availability and γ-GCS activity (8). The intracellular cysteine pool is a rate-limiting step for GSH synthesis, as glutamate and glycine are present in high concentrations in cells (9).
1.2.2 The cysteine/cystine cycle and transporter
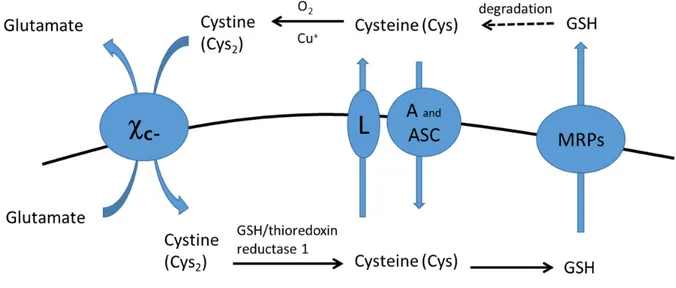
Cysteine is unique amino acid because its sulfhydryl group. While cysteine is existing predominantly inside the cell, cystine, its disulfide form, is predominant outside the cell (10). Cysteine is readily autoxidized to cystine in extracellular fluid. Cystine can be transported into cell by system c- (Fig. 4). In reducing environment of inside the cell, cystine is rapidly
reduced to cysteine, which is used for GSH biosynthesis (11). It has been reported that cysteine can be transported into cells via several amino acid transporters. System alanine-serine-cysteine (ASC) transports neutral amino acids such as cysteine, threonine, asparagine, alanine, serine, and, to some extent, glutamine (12). And System A, System L, and excitatory amino acid transporters (EAATs) have been proposed as cysteine transporter (13). Mammalian cells are unable to synthesize cysteine de novo and the trans-sulfuration pathway which is required for the synthesis of cysteine from methionine is only present in the liver and a few other tissues (10). Therefore, the major source of cysteine in most cells is the cystine uptake via system c-.
Fig. 4. Cysteine/cystine cycle and amino acid transporters.
Most cells exhibit cystine transport activity and thus can survive and proliferate in culture media (14). However, some cells that have reduced cystine transport activity, such as mouse lymphocytes, cannot adapt to standard culture conditions (15, 16). These cells require 2-mercaptoethanol (2-ME), a cystine uptake enhancer, to survive and proliferate in vitro (17, 18).
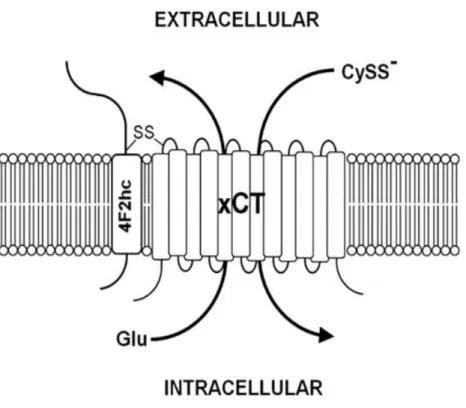
1.2.3 System c-: sodium-independent cystine/glutamate antiporter
The cystine/glutamate antiporter system c- is a sodium-independent and chloride-dependent
amino acid antiporter. It mediates the uptake of the cystine into cells in exchange with glutamate in a 1:1 ratio (19). Although system c- can transport both amino acids in both
directions, due to the gradient of intracellular and extracellular substrate concentration, it generally imports cystine and exports glutamate.
System c- is composed of two protein components, 4F2 heavy chain (4F2hc/SLC3A2) and
xCT light chain (SLC7A11) (Fig. 5). The xCT light chain subunit is responsible for the primary transport activity, while 4F2hc acts in the trafficking of the light chain and is required for cell surface expression (20).
Fig. 5. Structure of system c-. System c-. is composed of the 4F2 heavy chain (4F2hc) and
1.3 2-deoxy- D-ribose (dRib) induced pancreatic β-cell damage
1.3.1 2-deoxy-D-ribose (dRib)
Sugars containing an aldehyde groups and being oxidized to carboxylic acids are defined as reducing sugars. Among reducing sugars, glucose has the lowest reactivity, while 2‑deoxy‑D
-ribose (dRib) has the highest reactivity (22) (Fig. 6). Consequently, it takes considerable time for glucotoxicity occurs in β-cells with exposure to high glucose concentration. It has been reported that when HIT-T15 cells are cultured in media containing high glucose concentration, it takes about 20 weeks to decrease insulin mRNA levels, insulin content, and insulin secretion (23). It is difficult and time consuming to produce toxic effect of glucose on β-cells in experiments. Therefore, we chose dRib to induce oxidative damage of pancreatic β -cells
in vitro.
1.3.2 dRib induced oxidative stress and apoptosis in β-cell
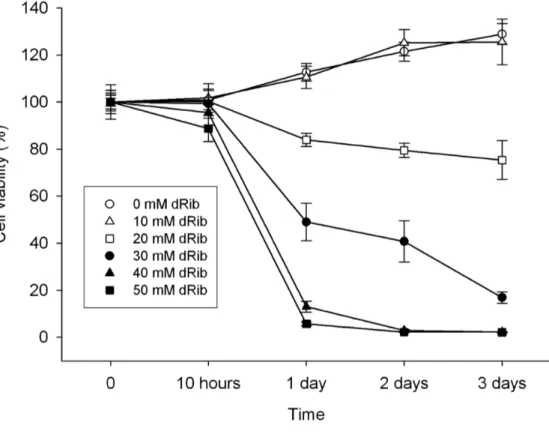
Previous studies have shown that dRib induces oxidative stress and apoptosis in β-cell line within 24 hours (24). In HIT-T15 cell, insulin-secreting pancreatic β-cell line, dRib showed a dose-dependent increase in cell death and a time-dependent rise in cytotoxicity (Fig. 7). dRIb did not affect cell viability at 10mM, but induced cell death at concentration above 20 mM.
Fig. 7. The effect of dRib treatment at various concentrations on pancreatic β-cell line. HIT-T15 cells were cultured in RPMI-1640 medium containing 0.5% FBS and various concentrations of dRib for the indicated times. Cell viability was determined by a modified MTT assay. Values represent means ± SD of four samples. (Adapted from Koh et al. (24))
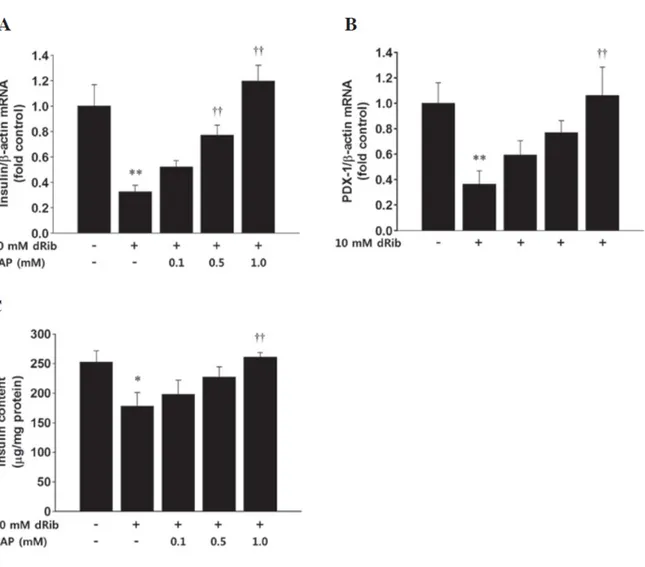
dRib decreased insulin mRNA levels and insulin content in rat islets (Fig. 8) (25). Stimulation of the isolated rat islets with 10 mM dRib for 6 h significantly decreased the mRNA expression levels of insulin and PDX-1.
Fig. 8. 2‑deoxy‑D‑ribose(dRib)‑induced decrease in the mRAN expression level of (A)
insulin, (B) pancreatic and duodenal homeobox 1 (PDX-1), and (C) insulin content in rat islets. (Adapted from Koh et al. (25))
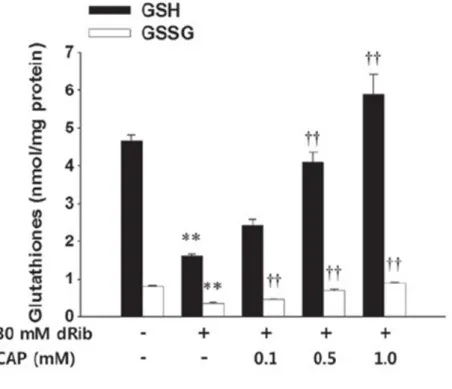
dRib decreased the intracellular level of GSH and GSSG in HIT-T15 cells and captopril showed protective effect on dRib induced glutathione depletion (Fig. 9) (25). Captopril is anti-hypertensive agent that is an angiotensin‑converting enzyme inhibitor (ACEI). Previous studies have suggested that structure of sulfhydryl groups in captopril act as an antioxidant to reduce oxidative stress in cellular models (26). Pre-treatment with captopril increased the intracellular levels of both GSH and GSSG. These finding suggested that dRib and captopril regulates the total intracellular levels of glutathione rather than the intracellular glutathione redox potential. Captopril prevented dRib-induced cytotoxicity and apoptosis in HIT-T15 cells (25).
Fig. 9. 2‑deoxy‑D‑ribose (dRib)‑induced depletion of intracellular reduced (GSH) and
oxidized (GSSG) glutathione content and effect of captopril (CAP) treatment.HIT‑T15 cells were pre‑incubated with 0.1, 0.5, or 1.0 mM CAP for 30 min prior to being cultured with 30 mM dRib for 6 h. The intracellular glutathione concentrations were measured using a Glutathione Assay kit. The data are presented as the mean ± standard error. **P<0.01, vs. the control group, and ††P<0.01, vs. the 30 mM dRib group, as determined by one‑way analysis of variance and Duncan's post‑hoc test. (Adapted from Koh et al. (25))
These dRib-induced β-cell damages were prevented by not only captopril, but also by treatements that increase intracellular GSH, such as alpha lipoic acid or gliclazide.(25, 27, 28). Accordingly we can conclude that the major mechanism of dRib-induced oxidative damage is intracellular GSH depletion.
1.4 Objectives
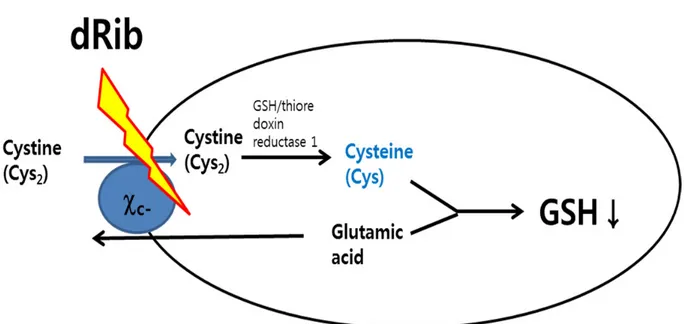
We hypothesized that dRib depletes GSH levels through the inhibition of intracellular cystine uptake via the system c- (Fig. 10). First, the effects of dRib on cystine transport and
intracellular GSH content were assessed. Next, whether cystine uptake-enhancing 2-ME reverses the dRib-induced changes was determined. To determine whether system
c-deficiency mediates β-cell damage induced by dRib, xCT, the substrate-specific subunit of the system c-, was overexpressedusing a lentiviral vector in RINm5F cells. The effects of
the overexpression of xCT on dRib-induced changes were also evaluated.
1. Materials and Methods
2.1 Materials
2-Deoxy-D-ribose, 3-[4,5-dimethylthiazol-2-yl]-2,5-diphenyl tetrazolium bromide (MTT),
dichlorodihydrofluorescein diacetate (H2DCF-DA), dimethylsulfoxide and Triton X-100 were
purchased from Sigma-Aldrich (St Louis, MO). Streptomycin sulfate, HEPES, trichloroacetic acid (TCA), guanidine hydrochloride, potassium phosphate monobasic, and potassium phosphate dibasic were obtained from Amresco (Solon, OH). Hydrochloric acid (HCl) and ethanol were purchased from Merck Millipore (Darmstadt, Germany). RPMI-1640, Dulbecco phosphate-buffered saline (DPBS), trypsin, penicillin, and streptomycin were purchased from Gibco Life Technologies (Carlsbad, CA, USA). Fetal bovine serum (FBS) was purchased from GE Healthcare Life Sciences (Logan, UT, USA). All culture dishes and tubes were purchased from BD Biosciences (Franklin Lakes, NJ, USA).
2.2 Cell cultures
Rat insulinoma (RINm5F) cells were obtained from the Korean Cell Line Bank (Seoul, Korea). The cells were cultured at 37˚C in an atmosphere containing 5% CO2 and 95% O2, in RPMI-1640 medium supplemented with 10% FBS, 100 mg/ml penicillin, and 100 mg/ml streptomycin. The cells were separated by trypsinization and subcultured until reaching ~70% confluence. Two days following subculture, the culture medium was discarded and replaced with RPMI-1640 supplemented with 10% FBS, and various concentration of dRib, 4 mM SASP or 1 mM HCA were added with or without various concentrations of 2-ME to the medium. The cultures were then incubated for 1, 6, 12, or 24 h.
2.3 Assessment of cell viability
Cell viability was measured by MTT assay and trypan blue exclusion. The RINm5F cells were cultured in 24-well plates at a density of 1x10⁵ cells per well. They were incubated with 30 mM dRib for 24 h, with or without 2-ME. Then, cells were harvested and stained vitally with 0.4% trypan blue for 5 min. A sample was transferred to a hemocytometer, where dead cells that did not exclude the dye and viable cells that did exclude it were counted. Cells incubated with culture medium alone, representing 100% viability, were included as a control in all experiments to allow estimation of the percentage viability of the cell samples. The MTT assays to evaluate cell viability were performed as described (29)
2.4 Flow cytometry to assess apoptosis
The RINm5F cells were stained with fluorescein isothiocyanate (FITC)-conjugated Annexin V and propidium iodide (PI) using a Vybrant Apoptosis Assay kit #2, according to the manufacturer's instructions (Molecular Probes Life Technologies, Carlsbad, CA, USA). Briefly, the RINm5F cells were cultured in six-well plates at a density of 5x10⁵ cells/well.
The cells were then treated with 30 mM dRib for 24 h. Following gentle washing with PBS, the cells were collected by trypsinization and centrifugation. The cell pellets were resuspended in PBS and centrifuged (200 x g for 5 min at 4˚C), prior to being resuspended and incubated with FITC-conjugated Annexin V and PI staining solution at room temperature for 15 min. The stained cells were analyzed using a FACSCalibur fluorescence-activated cell sorter (BD Bioscience, San Jose, CA, USA), and the data were analyzed using CellQuest software (BD Bioscience).
2.5 Assessment of the intracellular levels of ROS
Intracellular ROS levels were investigated using a H2DCF-DA dye. Cellular fluorescence intensity is directly correlated with intracellular ROS levels. The RINm5F cells were plated in 24-well culture plates at a density of 5x10⁵ cells/well. The cells were treated with 30 mM
dRib for 6 h. A total of 10 μM H2DCF-DA was added to the cell cultures 30 min prior to harvesting. The cells were then washed twice with PBS and harvested using 0.05% trypsin. The cells were then centrifuged and resuspended in PBS, and the intracellular levels of ROS were measured using a FACScan instrument (BD Bioscience). A total of 1x10⁴ cells were analyzed per sample. The data were calculated as the mean fluorescence intensity, and expressed as the fold difference, as compared with control untreated cells.
2.6 Determination of the intracellular levels of glutathione
Intracellular GSH level was measured using a Glutathione Assay Kit (Cayman Chemical Company, Ann Arbor, MI, USA) based on an enzymatic recycling method using glutathione reductase. The cells were cultured in six-well culture plates at a density of 5 x 10⁵ cells per well. The cells were treated as described above. Cells were washed with ice-cold DPBS and sonicated followed by centrifugation at 10,000 g for 15 min at 4°C. The resulting supernatants were used immediately for measurements of GSH and GSSG. The amount of total cellular protein in the sample was determined using a BCA protein assay kit (Pierce). The intracellular GSH and GSSG contents were corrected for the total protein content (g/mL) and expressed as nmol/mg protein.
2.7 Measurement of cystine transport
Intracellular uptake of L-[14C]cystine was measured following a previously described
procedure with minor modification (30). Briefly, the cells were plated in 24-well cell culture plates at a density of 3 x 10⁵ cells per well. The cells were incubated with RPMI-1640 medium supplemented with 10% FBS for two days. Then, the medium was removed and the cells were rinsed with 500 L extracellular fluid (ECF) buffer consisting of 122 mM NaCl, 25 mM NaHCO3, 3 mM KCl, 1.4 mM CaCl2, 1.2 mM MgSO4, 0.4 mM K2HPO4, 10 mM D-glucose, and 10 mM Hepes (pH 7.4) at 37°C. When Na+ dependency of the cystine uptake was examined, sodium containing compounds in the buffer were replaced by their choline equivalents. The uptake assay was initiated by the addition of 500 L ECF buffer containing 0.1 Ci L-[14C]cystine (1.7 M) at 37°C in the presence or absence of dRib, SASP, or HCA,
with or without 2-ME, for a specific time period. The uptake was terminated by removing the solution and rinsing the cells twice with radioisotope-free cold ECF buffer. Cells were then lysed in 750 L 1% Triton-X 100/DPBS. An aliquot of 500 L of the solubilized cells was added to 5 mL scintillation cocktail, and the radioactivity of incorporated cystine was determined using a liquid scintillation counter (PerkinElmer) or a Wallac MicroBeta TriLux 1450 LSC and Luminescence Counter (PerkinElmer). A protein assay was performed on the remaining 15 L aliquot using a bicinchoninic acid (BCA) protein assay kit (Pierce, Rockford, IL, USA). The L-[14C]cystine uptake was expressed either as cpm/g protein or as pmol/mg
2.8 Cell transfection
Lentiviral particles encoding for SLC7A11(cat. RR208495L4V) or control lentiviral particles(cat. PS100093V) were purchased from OriGene (Rockville, MD, USA). Transduction was performed according to the manufacturer's instructions. Briefly, RINm5F cells were seeded in 24 well tissue culture plates and infected the following day with lentiviral particles at a MOI of 10 in the presence of 8 μg/ml polybrene, purchased from Sigma (St. Louis, MO). Transduced cells were selected with puromycin (1.4μg/ml, Sigma) for 1 week until stably transduced cells were generated.
2.9 RNA isolation and reverse transcription quantitative polymerase chain reaction (RT qPCR).
Total RNA was isolated using TRIzol®, according to the manufacturer's instructions. RNA isolation was carried out in an RNase-free environment. A total of 2 µg aliquots of RNA were reverse transcribed using MMLV reverse transcriptase (MGmed Corporation, Seoul, Korea), oligo (dT)15 primer, dNTP (10 mM) and 40 unit/µl RNase inhibitor (MGmed Corporation). RT-qPCR was performed using a KAPA SYBR® FAST qPCR Master Mix (KAPA biosystems, MA, USA) and an iQTM 5 Multicolor Real-Time PCR Detection system (Bio-Rad Laboratories, Inc.). The PCR was performed to amplify the synthesized cDNA in the
sec, with an initial cycle of 95˚C for 1 min. The PCR reactions were carried out using the following primers for the cDNA sequences: xCT forward, 5’-TCAAATCCTTGGCCATCTGC-3’, and reverse, 5’-GTGAGCTTGCCCCACTGTAT-3’ and β-actin forward, 5'-TCC TGG CCT CAC TGT CCAC-3', and reverse, 5'-GGG CCG GAC TCA TCG TACT-3'. All primers were synthesized by Bioneer Corporation (Daejeon, Korea).
2.10 Statistical analysis.
All data were expressed as the mean SD. Comparisons between groups were analyzed by one-way analysis of variance (ANOVA) followed by Duncan’s post hoc test. All analyses were performed using SPSS software (version 14.0; SPSS Inc., Chicago, IL, USA) and p < 0.05 was considered significant.
3 Results
3.1 dRib inhibits cystine transport and decreases intracellular GSH content
To prove our hypothesis, the effect of dRib on intracellular cystine uptake was assessed. RINm5F cells were incubated in ECF buffer containing L-[14C]cystine with various
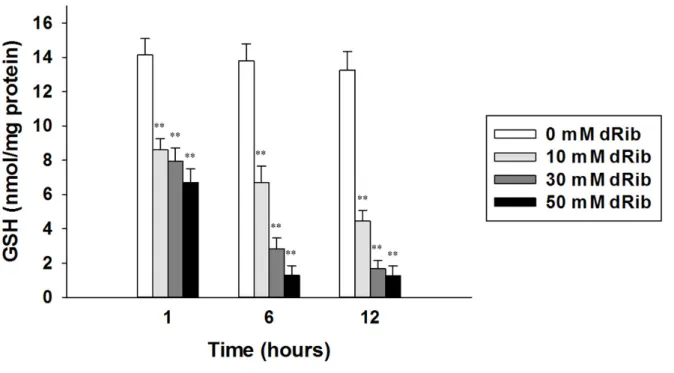
concentrations of dRib for 1, 6, and 12 h. Stimulation with dRib significantly decreased the radioactivity incorporated into the cells in a dose-dependent manner. As was expected, the radioactivity in all groups gradually increased over time (Fig. 11). Cystine transport is an essential process for intracellular GSH synthesis (31). Therefore, the changes in intracellular GSH content were assessed according to the dRib concentration. Stimulation with 10, 30, and 50 mM dRib dose-dependently depleted intracellular GSH content, and the dRib-induced GSH depletion worsened over time. The control group (0 mM dRib), however, showed no difference in GSH content over time (Fig. 12).
Fig. 11. Dose- and time-responses of intracellular L-[14C]cystine uptake in RINm5F cells. The
cells were incubated with extracellular fluid buffer containing 1.7 μM L-[14C]-cystine (0.2
μCi/mL) at 37C in the various concentrations of dRib for the indicated time period. The radioactivity incorporated into the cells was determined by a liquid scintillation counter. The data are presented as the mean ± SD. This experiment was performed twice, in quadruplicate. **p < 0.01, vs. 0 mM dRib group, as determined by one-way analysis of variance and
Fig. 12. GSH content stimulated with dRib in RINm5F cells. The cells were incubated with RPMI-1640 media containing 10% FBS in the various concentrations of dRib for the
indicated time period. The intracellular GSH concentration was measured using a glutathione assay kit. The data are presented as the mean ± SD. This experiment was performed twice, in quadruplicate. **p < 0.01, vs. 0 mM dRib group, as determined by one-way analysis of variance and Duncan's post-hoc test.
3.2 2-ME prevents dRib-induced decreases in cystine transport, GSH content, and cell viability
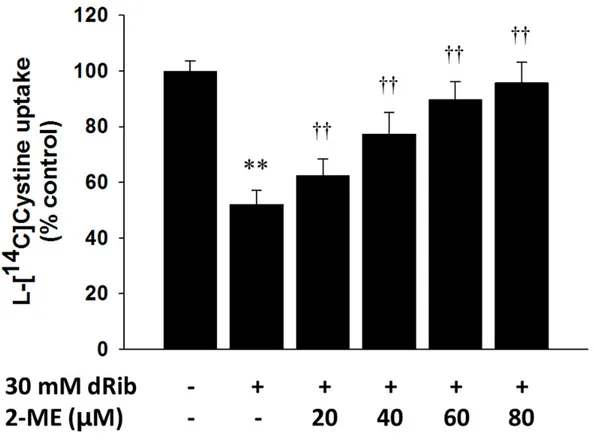
2-ME enables cells to utilize cystine in the medium, and it allows the intracellular GSH level to be maintained during cell culture (17, 18). Therefore, if 2-ME reverses the dRib-induced changes, it can be assumed that dRib inhibits cystine transport. RINm5F cells were stimulated with dRib and 2-ME for specific periods and intracellular L-[14C]cystine uptake,
GSH content, and cell viability were assessed. The addition of 2-ME significantly reversed dRib-induced suppression in L-[14C]cystine uptake and prevented dRib-induced GSH
depletion and cytotoxicity in a dose-dependent manner. Notably, 80 m 2-ME nearly fully reversed the dRib-induced changes (Fig. 13, 14, and 15). To assess the effects of dRib and 2-ME on the cellular redox potential, the intracellular GSSG levels were measured and compared to the GSH/GSSG ratios between treatment groups. The GSH/GSSG ratios did not differ between the control, 30 mM dRib alone, and 30 mM dRib groups with 20, 40, 60, and 80 m 2-ME (9.4 0.4, 8.8 2.1, 8.9 2.1, 9.2 1.2, 9.8 0.9, and 10.1 1.0, respectively; p for ANOVA = 0.396) (Fig. 14).
Fig. 13. Effects of 2-mercaptoethanol (2-ME) treatment on the dRib-induced decreases in L
-[14C]cystine uptake. RINm5F cells were co-stimulated with 20, 40, 60, or 80 μM 2-ME and 30 mM dRib for 6 h in the extracellular fluid buffer containing 1.7 μM L-[14C]cystine (0.2
μCi/mL) at 37C . The radioactivity incorporated into the cells was determined by a liquid scintillation counter. The data are presented as the mean ± SD. This experiment was
performed twice, in quadruplicate. **p < 0.01 vs. control; ††p < 0.01 vs. 30 mM dRib alone, as determined by one-way analysis of variance and Duncan's post-hoc test.
Fig. 14. Effects of 2-mercaptoethanol (2-ME) treatment on the dRib-induced decreases in intracellular GSH content. The cells were co-stimulated with 20, 40, 60, or 80 μM 2-ME and 30 mM dRib for 6 h in RPMI-1640 media containing 10% FBS. The intracellular GSH concentration was measured using a glutathione assay kit. The data are presented as the mean ± SD. This experiment was performed twice, in quadruplicate. **p < 0.01 vs. control; ††p < 0.01 vs. 30 mM dRib alone, as determined by one-way analysis of variance and Duncan's post-hoc test.
Fig. 15. Effects of 2-mercaptoethanol (2-ME) treatment on the dRib-induced decreases in cell viability. The cells were co-stimulated with 20, 40, 60, or 80 μM 2-ME and 30 mM dRib for 24 h in RPMI-1640 media containing 10% FBS. The Cell viability was determined by an MTT assay. The data are presented as the mean ± SD. This experiment was performed twice, in quadruplicate. **p < 0.01 vs. control; ††p < 0.01 vs. 30 mM dRib alone, as determined by one-way analysis of variance and Duncan's post-hoc test.
3.3 2-ME Na+-independently prevents dRib-induced decreases in cystine transport
There are various arguments regarding the mechanisms of 2-ME-induced stimulation of cystine uptake. 2-ME assists cells with the utilization of cystine by forming a mixed disulfide of 2-ME and cysteine (17) or reducing cystine in the media to cysteine (32). A recent study reported that 2-ME accelerates cystine transport via system c-, an Na+-independent
cystine/glutamate antiporter (33). The mixed disulfide and cysteine can be transported into cells via system ASC, an Na+-dependent neutral amino acid transport system. Therefore, if 2-ME reverses the dRib-induced cystine transport Na+-independently, it can be assumed that dRib inhibits cystine transport via system c-. RINm5F cells were stimulated with 30 mM
dRib, with or without 80 M 2-ME, and the intracellular L-[14C]cystine uptake was then
assessed in the presence and absence of extracellular Na+. The addition of 2-ME promoted L
Fig. 16. Effect of 2-ME treatment on the dRib-induced inhibition in cystine transport in the presence and absence of extracellular Na+. **p < 0.01 vs. control; ††p < 0.01 vs. 30 mM dRib
3.4 SASP and HCA reduce cystine transport and GSH concentration, and the reductions are prevented by 2-ME
SASP and HCA are known inhibitors of cystine transport via system c- (11, 34). If these
inhibitors can influence intracellular cystine uptake and GSH content, as dRib did, under the experimental conditions of this study, it would strengthen the hypothesis that dRib depletes GSH content through the inhibition of cystine transport. Therefore, the effects of SASP and HCA on cystine uptake and GSH content and its reversibility by 2-ME were evaluated. Stimulation with SASP or HCA significantly decreased intracellular L-[14C]cystine uptake
and GSH levels, and the addition of 2-ME completely reversed the decreases (Fig. 17 and 18). These findings are consistent with those for dRib.
Fig. 17. Effects of 2-mercaptoethanol (2-ME) treatment on sulfasalazine (SASP) or
homocysteic acid (HCA)-induced decreases in intracellular L-[14C]cystine uptake. RINm5F
cells were co-stimulated with 60 μM 2-ME and 4 mM SASP or 1 mM HCA for 6 h in the extracellular fluid buffer containing 1.7 μM L-[14C]cystine (0.2 μCi/mL) at 37C. The
radioactivity incorporated into the cells was determined by a liquid scintillation counter. The data are presented as the mean ± SD. This experiment was performed twice, in quadruplicate. **p < 0.01 vs. control; ††p < 0.01 vs. 4 mM SASP alone; ‡‡p < 0.01 vs. 1 mM HCA alone, as determined by one-way analysis of variance and Duncan's post-hoc test.
Fig. 18. Effects of 2-mercaptoethanol (2-ME) treatment on sulfasalazine (SASP) or homocysteic acid (HCA)-induced decreases in GSH content. The cells were co-stimulated with 60 μM 2-ME and 4 mM SASP or 1 mM HCA for 6 h in RPMI-1640 media containing 10% FBS. The intracellular GSH concentration was measured using a glutathione assay kit. The data are presented as the mean ± SD. This experiment was performed twice, in quadruplicate. **p < 0.01 vs. control; ††p < 0.01 vs. 4 mM SASP alone; ‡‡p < 0.01 vs. 1 mM HCA alone, as determined by one-way analysis of variance and Duncan's post-hoc test.
3.5 Enforced expression of xCT overcomes dRib-induced decreases in cystine transport, GSH content, and cell viability
To determine whether deficiency of system c- mediates the dRib-induced β-cell damage,
xCT, the substrate-specific subunit of the system c-,was overexpressedby using a lentiviral
vector in RINm5F cells. The cells were transfected with lentiviral particles encoding xCT or empty vector, allowing the stable selection of transfected cells by puromycin. Single-cell clones were isolated, and one empty vector-transfected and two xCT-transfected clones (xCT3 and xCT10) were used for further studies. xCT expression was confirmed by GFP fluorescence (Fig. 19) and the quantitative RT-PCR of xCT mRNA (Fig. 20).
Fig. 19. Enforced expression of xCT in RINm5F cells. xCT transfection was confirmed by GFP fluorescence. Empty vector; empty viral vector-transfected clone, xCT3 and xCT10; two xCT-expressing vector transfected clones
Fig. 20. Enforced expression of xCT in RINm5F cells. Real-time quantitative reverse transcription-quantitative polymerase chain reaction (qRT-PCR) analysis of xCT mRNA expression in RIN-5F cells transfected with xCT-expressing or empty viral vector. Relative expression of the mRNA was calculated using the 2−ΔΔCT method. The expression levels were normalized against the control group. Total RNA of the cells was extracted, and the mRNA expression levels of xCT was analyzed by RT-PCR. Data are presented as the mean ± SD. This experiment was performed four times. **p < 0.01, vs. empty vector as determined by one-way analysis of variance and Duncan's post-hoc test. Control; uninfected RIN-5F cells, Empty vector; empty viral vector-transfected clone, xCT3 and xCT10; two xCT-expressing vector transfected clones.
The control and xCT-overexpressing cells were stimulated with various concentrations of dRib at specific periods and intracellular L-[14C]cystine uptake, GSH content, and cell
viability were then assessed. The overexpression of xCT significantly increased L
-[14C]cystine uptake and intracellular GSH levels. In addition, this overexpression recovered the dRib-induced suppression of L-[14C]cystine uptake (Fig. 21), GSH depletion (Fig. 22),
Fig. 21. Effects of enforced expression of xCT on the dRib-induced decreases in L
-[14C]cystine uptake. The cells were incubated with extracellular fluid buffer containing 1.7 μM L-[14C]cystine (0.2 μCi/mL) at 37℃ for 1 hour with the various concentrations of
2-deoxy-D-ribose (dRib). The radioactivity incorporated into the cells was determined using a
liquid scintillation counter. Data are presented as the mean ± SD. This experiment was performed in quadriplicate, thrice. **p < 0.01, vs. 0 mM dRib group, as determined by one-way analysis of variance and Duncan's post-hoc test. Control; uninfected RINm5F cells, Empty vector; empty viral vector-transfected clone, xCT3 and xCT10; two xCT-expressing vector transfected clones.
Fig. 22. Effects of enforced expression of xCT on the dRib-induced decreases in intracellular GSH content. The cells were incubated with RPMI-1640 media containing 10% FBS in 0, 30 and 50 mM dRib for 6 hours. The intracellular GSH concentration was measured using a glutathione assay kit. Data are presented as the mean ± SD. This experiment was performed in quadriplicate, thrice. **p < 0.01, vs. 0 mM dRib group, as determined by one-way analysis of variance and Duncan's post-hoc test. Control; uninfected RINm5F cells, Empty vector; empty viral vector-transfected clone, xCT3 and xCT10; two xCT-expressing vector transfected clones.
Fig. 23. Effects of enforced expression of xCT on the dRib-induced decreases in cell viability. The cells were stimulated with 0, 10, 20, 30, 40 or 50 mM dRib for 24 h in RPMI-1640 media containing 10% FBS. Cell viability was determined by an MTT assay. Data are presented as the mean ± SD. This experiment was performed in quadriplicate, thrice. **p < 0.01, vs. 0 mM dRib group, as determined by one-way analysis of variance and Duncan's post-hoc test. Control; uninfected RINm5F cells, Empty vector; empty viral vector-transfected clone, xCT3 and xCT10; two xCT-expressing vector vector-transfected clones.
3.6 The enforced expression of xCT recovers the dRib-induced increase in intracellular levels of ROS and apoptosis
A 24 h stimulation with 30 mM dRib increased the percentage of apoptotic cells as shown by Annexin V and PI double staining in the control and the empty vector-transfected with RINm5F cells. However, these changes were reversed in xCT overexpressing cells (Table 1, Fig. 24).
Table 1. Percentage of annexin V-positive cells in control and RINm5F cells transfected with xCT-expressing or empty viral vector.
Annexin V-positive cells (%)
0 mM dRib 30 mM dRib
Control 2.6 ± 0.9 72.1 ± 18.1**
Empty vector 2.1 ± 0.9 75.9 ± 12.1**
xCT3 2.9 ± 1.1 58.4 ± 0.1**
xCT10 2.5 ± 0.8 47.0 ± 27.7**
Group data from the experiments illustrated in Fig. 7 expressed as means ± SE of four independent experiments. Control, uninfected RINm5F cells; Empty vector, empty viral vector-transfected clone; xCT3 and xCT10, two xCT-expressing vector transfected clones.
Fig. 24. Flow cytometric analysis for apoptosis in RINm5F cells transfected with
xCT-expressing or empty viral vector. The cells were incubated with RPMI-1640 media containing 10% FBS for 24 hours with or without 30 mM 2-deoxy-D-ribose (dRib). The cells were
stained with annexin V-FITC (horizontal axis)/PI (longitudinal axis) and analyzed by flow cytometry. The graph is representative of four independent experiments. (A) Control,
uninfected RINm5F cells; (B) Empty vector, empty viral vector-transfected clone; (C and D) xCT3 and xCT10, two xCT-expressing vector transfected clones.
The flow cytometric analysis using the ROS-sensitive dye H2DCF-DA determined that 30
mM dRib stimulation for 6 h increased the levels of ROS by more than five-fold in the control and empty vector-transfected RINm5F cells. The enforced expression of xCT reversed the dRib-induced increase in intracellular levels of ROS (Table 2, Fig. 25).
Table 2. Relative intracellular ROS levels in control and RINm5F cells transfected with xCT-expressing or empty viral vector.
Relative fluorescence (fold control)
0 mM dRib 30 mM dRib
Control 1 20.1 ± 1.1**
Empty vector 2.2 ± 0.1 13.6 ± 7.7**
xCT3 2.8 ± 0.4 3.9 ± 0.5††
xCT10 2.4 ± 0.1 3.5 ± 0.6††
Group data from the experiments illustrated in Fig. 7 expressed as means ± SE of four independent experiments. Control, uninfected RINm5F cells; Empty vector, empty viral vector-transfected clone; xCT3 and xCT10, two xCT-expressing vector transfected clones.
**p<0.01 vs. control with 0mM dRib and ††p< 0.01 vs. control with 30 mM dRib, by one-way
Fig. 25. Flow cytometric analysis for intracellular reactive oxygen species (ROS) levels in RINm5F cells transfected with xCT-expressing or empty viral vector. The cells were
incubated with RPMI-1640 media containing 10% FBS for 6 hours with or without 50 mM 2-deoxy-D-ribose (dRib). Relative ROS levels were quantified by flow cytometry using the
ROS-sensitive dye H2DCF-DA. The histogram is representative of four independent experiments. (A) Control, uninfected RINm5F cells; (B) Empty vector, empty viral vector-transfected clone; (C and D) xCT3 and xCT10, two xCT-expressing vector vector-transfected clones.
4 Discussion
In this study, dRib was found to decrease intracellular cystine uptake, GSH content, and cell viability, and 2-ME was found to recover the dRib-induced decreases, Na+-independently. SASP and HCA, system c- inhibitors, reduced intracellular cystine uptake and GSH content
in a similar manner to dRib, and these reductions were restored by 2-ME. In addition, the enforced expression of xCT, the substrate-specific subunit of the system c-,fully recovered
the dRib-induced decreases in L-[14C]cystine uptake and GSH content and prevented the
dRib-induced ROS rises, cytotoxicity, and apoptosis. Based on this, our findings suggest that dRib depletes intracellular GSH content through inhibition of the cystine transport via system c-. In addition, the results suggest that the deficiency of system c- in pancreatic β-cells play
a critical role in oxidative stress-induced damage.
Few studies have been conducted to elucidate the mechanism underlying the intracellular GSH depletion caused by dRib. Fico et al. (35) reported that dRib depleted intracellular GSH by inhibiting the synthesis and increasing the efflux of GSH. They demonstrated that the activity of glutamate cysteine ligase (GCL), the rate-limiting enzyme in GSH biosynthesis, was reduced by treatment with dRib. However, the reduction in GCL activity could result from decreased cystine transport, which leads to a reduced concentration of the enzyme substrate. They also showed a dRib-induced rise in GSH concentration in the culture medium
by increasing GSH efflux. In the present study, however, stimulation with various concentrations of dRib in the culture medium did not elevate the GSH levels compared with unstimulated cells (Suppl. Fig. 1). Therefore, we believe that the inhibition of cystine transport (rather than the inhibition of GSH synthesis or an increase in GSH efflux) is the mechanism underlying the dRib-induced GSH depletion. Backos et al. (36) demonstrated that dRib glycated GCL and reduced its activity in vitro. However, they did not target cells, and the intracellular GSH content was not measured. Therefore, there is currently no substantial evidence that protein glycation is the mechanism underlying dRib-induced GSH depletion.
A variety of mammalian cells take up extracellular cystine via an Na+-independent cystine/glutamate transporter, designated as the system c- (37). The system c- is composed
of two protein components, a 4F2 heavy chain (4F2hc/SLC3A2) and an xCT light chain (xCT/SLC7A11). The xCT light chain subunit is responsible for the primary transport activity, while the 4F2 heavy chain, common to many amino acid transporters, acts in the trafficking of the light chain and is required for cell surface expression (20). The activity of system
c-depends mainly on xCT expression. It has been reported that xCT light chain overexpression alone significantly increases system c- activity in various cell types (21). The activity of
system c- is highly inducible by various stimuli, including oxidative stress, electrophilic
agents, and lipopolysaccharides (38). Upregulated cystine transport activity protects cells from oxidative stress by maintaining intracellular GSH levels. However, some cells like lymphocytes are incapable of inducing system c- and depend on the supply of extracellular
2-ME is its reaction with cystine in a culture medium producing cysteine or forming a mixed disulfide of 2-ME and cysteine (17). Both cysteine and the mixed disulfide can be transported into cells through system ASC, an Na+-dependent neutral amino acid transport system, regardless of system c- activity. The mixed disulfide within the cells is rapidly reduced to
produce cysteine, and it can maintain glutathione levels during cell culture (39). On the other hand, in insulin-secreting cells, a previous study has found that 2-ME increases cystine uptake Na+-independently, which mediates system c- (33).In this study, treatment with 2-ME
allows the cells to take up cystine Na+-independently, thereby circumventing system
c-inhibition. Considering these findings, therefore, it can be assumed that dRib suppresses cystine transport by inhibiting system c- in pancreatic β-cells.
Pancreatic β-cells are particularly vulnerable to oxidative stress in comparison to other cells. Experimental evidence shows that β-cells have relatively low levels of intrinsic antioxidant enzyme expression compared to other cell types. The expression of superoxide dismutase was within range of 30% of the liver values, and catalase and glutathione peroxidase expressions were extremely low, within range of 5% of the liver (40). Unlike previous evidence, Numazawa et al. reported that β-cells have a lower cystine transport capacity than other cells, thereby making them susceptible to oxidative stress (41). This result is consistent with the present study wherein system c- is involved in β-cell susceptibility to oxidative stress.
This study has some limitations. To investigate the role of the system c- for the
dRib-induced β-cell damage, RIN5mF cell clones were established that stably overexpress the rat xCT light chain. Transfection was confirmed by fluorescence microscopy and the overexpression of xCT by qPCR. However, this increased expression was not confirmed by Western blot analysis. Two commercial antibodies against xCT did not detect overexpression in the transfected cell line, which was also a problem faced by experts in the field. Overexpression of xCT was not detected by Western blotting, which was suggested by the results of cell viability and the cystine uptake test using the transfected cell line. In addition, the role of system c- in physiology and disease has been predominantly studied in neurons
and cancer cells, and the study of its role in relation to pancreatic β-cells is rare. Further studies are required with regards to the role of system c- in pancreatic β-cells and type 2
5 Conclusion
In conclusion, our findings suggest dRib depletes intracellular GSH content through the inhibition of cystine transport via system c-. The dRib-induced inhibition of cystine transport
has not yet been reported and is different from the mechanism proposed by Fico et al. (35). The overexpression of xCT showed protective effects against dRib-induced oxidative damage in RINm5F cells. This result suggests that the deficiency of system c- in pancreatic β-cells
6 References
1. Poitout V, Robertson RP. Minireview: Secondary beta-cell failure in type 2 diabetes--a convergence of glucotoxicity diabetes--and lipotoxicity. Endocrinology. 2002;143(2):339-42.
2. Robertson RP, Olson LK, Zhang HJ. Differentiating glucose toxicity from glucose desensitization: a new message from the insulin gene. Diabetes. 1994;43(9):1085-9.
3. Donath MY, Gross DJ, Cerasi E, Kaiser N. Hyperglycemia-induced beta-cell apoptosis in pancreatic islets of Psammomys obesus during development of diabetes. Diabetes. 1999;48(4):738-44.
4. Robertson RP. Chronic oxidative stress as a central mechanism for glucose toxicity in pancreatic islet beta cells in diabetes. J Biol Chem. 2004;279(41):42351-4.
5. Trachootham D, Lu W, Ogasawara MA, Nilsa RD, Huang P. Redox regulation of cell survival. Antioxid Redox Signal. 2008;10(8):1343-74.
6. Forman HJ, Zhang H, Rinna A. Glutathione: overview of its protective roles, measurement, and biosynthesis. Molecular aspects of medicine. 2009;30(1-2):1-12.
7. Jones DP. Redox potential of GSH/GSSG couple: assay and biological significance. Methods in enzymology. 2002;348:93-112.
8. Lu SC. Regulation of glutathione synthesis. Molecular aspects of medicine. 2009;30(1-2):42-59.
9. Dringen R, Hirrlinger J. Glutathione pathways in the brain. Biol Chem. 2003;384(4):505-16.
10. Lu SC. Regulation of hepatic glutathione synthesis. Seminars in liver disease. 1998;18(4):331-43.
11. Bannai S, Tateishi N. Role of membrane transport in metabolism and function of glutathione in mammals. J Membr Biol. 1986;89(1):1-8.
12. Christensen HN. Role of amino acid transport and countertransport in nutrition and metabolism. Physiol Rev. 1990;70(1):43-77.
13. Chen Y, Swanson RA. The glutamate transporters EAAT2 and EAAT3 mediate cysteine uptake in cortical neuron cultures. J Neurochem. 2003;84(6):1332-9.
14. Bannai S, Ishii T. Formation of sulfhydryl groups in the culture medium by human diploid fibroblasts. J Cell Physiol. 1980;104(2):215-23.
15. Hishinuma I, Ishii T, Watanabe H, Bannai S. Mouse lymphoma L1210 cells acquire a new cystine transport activity upon adaptation in vitro. In Vitro Cell Dev Biol. 1986;22(3 Pt 1):127-34.
16. Ishii T, Sugita Y, Bannai S. Regulation of glutathione levels in mouse spleen lymphocytes by transport of cysteine. J Cell Physiol. 1987;133(2):330-6.
17. Ishii T, Bannai S, Sugita Y. Mechanism of growth stimulation of L1210 cells by 2-mercaptoethanol in vitro. Role of the mixed disulfide of 2-2-mercaptoethanol and cysteine. J Biol Chem. 1981;256(23):12387-92.
18. Ishii T, Hishinuma I, Bannai S, Sugita Y. Mechanism of growth promotion of mouse lymphoma L1210 cells in vitro by feeder layer or 2-mercaptoethanol. J Cell Physiol. 1981;107(2):283-93.
19. Bannai S. Exchange of cystine and glutamate across plasma membrane of human fibroblasts. J Biol Chem. 1986;261(5):2256-63.
20. Bridges RJ, Natale NR, Patel SA. System xc(-) cystine/glutamate antiporter: an update on molecular pharmacology and roles within the CNS. Br J Pharmacol. 2012;165(1):20-34.
21. Lewerenz J, Hewett SJ, Huang Y, Lambros M, Gout PW, Kalivas PW, et al. The cystine/glutamate antiporter system x(c)(-) in health and disease: from molecular mechanisms to novel therapeutic opportunities. Antioxid Redox Signal. 2013;18(5):522-55.
22. Bunn HF, Higgins PJ. Reaction of monosaccharides with proteins: possible evolutionary significance. Science. 1981;213(4504):222-4.
23. Olson LK, Redmon JB, Towle HC, Robertson RP. Chronic exposure of HIT cells to high glucose concentrations paradoxically decreases insulin gene transcription and alters binding of insulin gene regulatory protein. J Clin Invest. 1993;92(1):514-9.
24. Koh G, Suh KS, Chon S, Oh S, Woo JT, Kim SW, et al. Elevated cAMP level attenuates 2-deoxy-d-ribose-induced oxidative damage in pancreatic beta-cells. Arch Biochem Biophys. 2005;438(1):70-9.
25. Koh G, Yang EJ, Kim JY, Hyun J, Yoo S, Lee SA. Intracellular glutathione production, but not protein glycation, underlies the protective effects of captopril against 2-deoxy-D-ribose-induced beta-cell damage. Mol Med Rep. 2015;12(4):5314-20.
26. Andreoli SP. Captopril scavenges hydrogen peroxide and reduces, but does not eliminate, oxidant-induced cell injury. Am J Physiol. 1993;264(1 Pt 2):F120-7.
27. Koh G, Kim MK, Yang EJ, Lee DH. Gliclazide does not fully prevent 2-deoxy-D-ribose-induced oxidative damage because it does not restore glutathione content in a pancreatic beta-cell line. Oxid Med Cell Longev. 2012;2012:390678.
2-deoxy-D-ribose-induced oxidative damage and suppression of insulin expression in pancreatic beta-cells. Biol Pharm Bull. 2013;36(10):1570-6.
29. Koh G, Lee DH, Woo JT. 2-Deoxy-D-ribose induces cellular damage by increasing oxidative stress and protein glycation in a pancreatic beta-cell line. Metabolism. 2010;59(3):325-32.
30. Tomi M, Hosoya K, Takanaga H, Ohtsuki S, Terasaki T. Induction of xCT gene expression and L-cystine transport activity by diethyl maleate at the inner blood-retinal barrier. Invest Ophthalmol Vis Sci. 2002;43(3):774-9.
31. Lewerenz J, Maher P. Control of redox state and redox signaling by neural antioxidant systems. Antioxid Redox Signal. 2011;14(8):1449-65.
32. Deneke SM, Fanburg BL. Regulation of cellular glutathione. Am J Physiol. 1989;257(4 Pt 1):L163-73.
33. Janjic D, Wollheim CB. Effect of 2-mercaptoethanol on glutathione levels, cystine uptake and insulin secretion in insulin-secreting cells. Eur J Biochem. 1992;210(1):297-304. 34. Gout PW, Buckley AR, Simms CR, Bruchovsky N. Sulfasalazine, a potent suppressor of lymphoma growth by inhibition of the x(c)- cystine transporter: a new action for an old drug. Leukemia. 2001;15(10):1633-40.
35. Fico A, Manganelli G, Cigliano L, Bergamo P, Abrescia P, Franceschi C, et al. 2-deoxy-d-ribose induces apoptosis by inhibiting the synthesis and increasing the efflux of glutathione. Free Radic Biol Med. 2008;45(2):211-7.
36. Backos DS, Fritz KS, McArthur DG, Kepa JK, Donson AM, Petersen DR, et al. Glycation of glutamate cysteine ligase by 2-deoxy-d-ribose and its potential impact on chemoresistance in glioblastoma. Neurochem Res. 2013;38(9):1838-49.
37. Bannai S, Christensen HN, Vadgama JV, Ellory JC, Englesberg E, Guidotti GG, et al. Amino acid transport systems. Nature. 1984;311(5984):308.
38. Conrad M, Sato H. The oxidative stress-inducible cystine/glutamate antiporter, system x (c) (-) : cystine supplier and beyond. Amino Acids. 2012;42(1):231-46.
39. Ishii T, Mann GE. Redox status in mammalian cells and stem cells during culture in vitro: critical roles of Nrf2 and cystine transporter activity in the maintenance of redox balance. Redox Biol. 2014;2:786-94.
40. Tiedge M, Lortz S, Drinkgern J, Lenzen S. Relation between antioxidant enzyme gene expression and antioxidative defense status of insulin-producing cells. Diabetes. 1997;46(11):1733-42.
41. Numazawa S, Sakaguchi H, Aoki R, Taira T, Yoshida T. Regulation of the susceptibility to oxidative stress by cysteine availability in pancreatic beta-cells. Am J Physiol Cell Physiol. 2008;295(2):C468-74.
![Fig. 11. Dose- and time-responses of intracellular L -[ 14 C]cystine uptake in RINm5F cells](https://thumb-ap.123doks.com/thumbv2/123dokinfo/4743175.12746/33.892.121.782.151.528/fig-dose-responses-intracellular-cystine-uptake-rinm-cells.webp)