2006-2016년 급성심장정지조사 주요 결과
질병관리본부 질병예방센터 만성질환관리과 윤성옥, 권윤형, 안주연, 홍성옥, 김영택* *교신저자 : ruyoung@korea.kr/ 043-719-7380들어가는 말
급성심장정지는 발생 24시간 전까지는 극히 정상적인 생활을
하던 사람에게 급작스럽게 발생하는 질환으로 임상적으로는 일시적
사망상태이다. 신속한 응급처치의 시행여부에 따라 생존 결과가 매우
크게 차이가 나기 때문에 급성심장정지를 인지한 목격자가 올바른
방법으로 빠르게 심폐소생술과 자동심장충격기를 사용하여 적절히
대처하고, 신고를 받은 119구급대가 이송 및 응급조치를 신속하게
처리하며, 의료기관에서 통합적인 치료가 적절히 시행된다면
임상적으로 사망상태에 있던 환자는 후유증 없이 완전하게 회복될
수 있다. 그러나 지역사회, 구급, 병원 단계 중 어느 한 단계의
처치라도 부적절하거나 늦어진다면 환자가 최종적으로 사망하거나,
Main results of Sudden Cardiac Arrest Survey 2006-2016
Yoon Sungock, Kwon Yunhyung, An juyeon, Hong Sungok, Kim Young Taek*Division of Chronic Disease Control, Center for Disease Prevention, KCDC
In 2008, Korea CDC has introduced ‘Sudden Cardiac Arrest Survey’ to identify the incidence and survival of sudden cardiac arrests in cooperation with National Fire Agency. Since then, it has been publishing sudden cardiac arrest statistics each year.
The results from 2006 to 2016 are as follows. There have been about 30,000 cases of sudden cardiac arrests occurring annually. Standardized incidence has increased from 39.3 (per 100,000 people) in 2006 to 41.5 (per 100,000 people) in 2016. Survival of the sudden cardiac arrest patients has increased 3.3 fold from 2.3% in 2006 to 7.6% in 2016. Neurological recovery rate has increased 7 fold from 0.6% in 2006 to 4.2% in 2016. Bystander CPR rate and rate of return of spontaneous circulation before hospital arrival, which are the two indices closely related to survival result, are both on the increasing trend. The sudden Cardiac Arrest survey has confirmed one positive and one negative aspects of the current status. On the positive side, there has been a nationwide improvement in sudden cardiac arrest survival, and on the negative side, the regional disparity widened. By feeding this statistical results back to the community, we hope to promote local community-based activities for the improved survival of cardiac arrest patients.
생존하더라도 심각한 후유장애가 발생하여 사회로 복귀하지 못하게
된다.
급성심장정지의 생존 수준을 향상시키기 위해서는 인구·
사회학적, 지역적 발생 규모 및 양상뿐만 아니라 생존 결과와
이에 영향을 끼치는 제반 요인들에 대한 정확한 자료가 필요하다.
미국, 일본, 북유럽 선진 국가들은 오래 전부터 국가를 대표하는
급성심장정지 자료를 등록·구축하고, 관련 지표 값과 통계치를 매년
지속적으로 산출하고 있다. 미국의 경우(Cardiac Arrest Registry to
Enhance Survival, CARES)는 전수 사례가 아닌 일부 지역 구급대
및 자발적인 참여 병원의 사례를 수집하고 있으며[1], 이러한 방식은
조사 효율성과 자료의 질은 높은 반면, 대표성과 실제성이 낮다고 할
수 있다. 일본에서는 조사항목의 대부분이 구급대 자료에 국한되어
있어 병원 단계의 치료 및 결과를 파악하기 어렵다[2]. 이러한 외국
사례의 단점을 극복하기 위하여 우리나라에서는 급성심장정지 사례
전수에 대해 발생, 구급, 병원 단계를 포함하도록 설계하였다.
2008년에 질병관리본부가 소방청(당시 행정안전부 소방본부)과
협력하여 급성심장정지 발생 현황, 대응 과정, 생존 결과를 파악하는
‘급성심장정지조사’를 도입하였으며, 소방청 및 시·도 소방재난본부,
17개 시·도 보건당국 및 254개 시·군·구 보건소, 그리고 약
600개 의료기관이 참여하는 국가 차원의 대규모 조사사업으로
119구급대에서 급성심장정지로 판단한 모든 환자를 대상으로
의무기록조사를 시행한다는 데에 그 특징이 있다. 이 조사를 도입한
2008년 이후 매년 급성심장정지 발생과 대응, 생존에 대해 국가를
대표하는 통계를 생산하고 있고, 2011년에는 국가통계로 승인
받았다.
그간 2 0 0 6 ∼2 0 1 6 년에 발생 한 급 성 심 장정 지에 대한
조사결과[3]를 소개하고자 한다.
몸 말
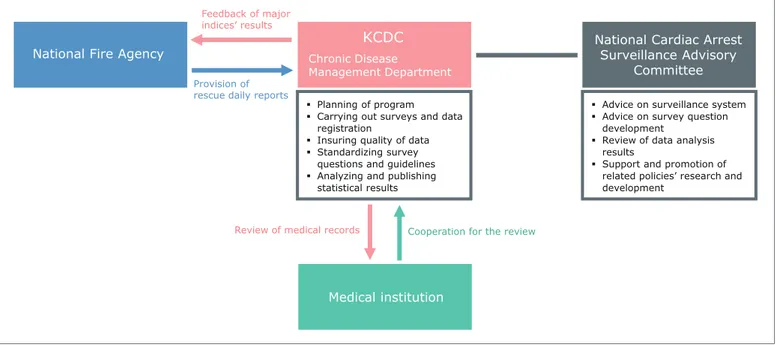
급성심장정지조사 체계
질병관리본부는 조사계획 수립과 의무기록 조사 수행, 자료 질
관리, 조사 문항 및 조사지침 표준화, 결과 분석 및 주요 지표 산출과
통계집 발간 등 사업 수행과 관련한 업무를 수행하고 있다. 또한,
관련 부처 및 학·협회 전문가로 구성된 국가 심장정지 조사·감시
자문위원회에서는 조사·감시체계 정비, 조사 문항 개발에 대한 자문,
분석 결과 검토 등을 통해 정책 개발 및 연구 활성화를 지원하고
있다. 이러한 모든 과정은 소방청과 17개 시·도 소방본부, 그리고
National Fire Agency
KCDC
National Cardiac ArrestSurveillance Advisory CommitteeMedical institution
Chronic Disease
Management Department Planning of program
Carrying out surveys and data registration
Insuring quality of data Standardizing survey
questions and guidelines Analyzing and publishing
statistical results
Advice on surveillance system Advice on survey question
development
Review of data analysis results
Support and promotion of related policies’ research and development
Feedback of major indices’ results
Provision of rescue daily reports
Review of medical records Cooperation for the review
전국 약 600개 병원의 협조를 통해 이루어진다. 소방청은 17개
시·도 소방본부 구급활동일지를 제공하고 있으며, 질병관리본부가
전체 구급활동일지에서 급성심장정지 사례를 추출하고, 환자가
이송된 병원명 등을 표준화하여 조사 수행을 위한 데이터베이스로
구축한다. 질병관리본부 소속 전문조사원은 급성심장정지 환자가
이송된 전국의 약 600개의 병원을 방문하여 해당 환자의 의무기록을
조사하고, 병원들은 적극적으로 협조하고 있다.
급성심장정지 발생 및 생존현황
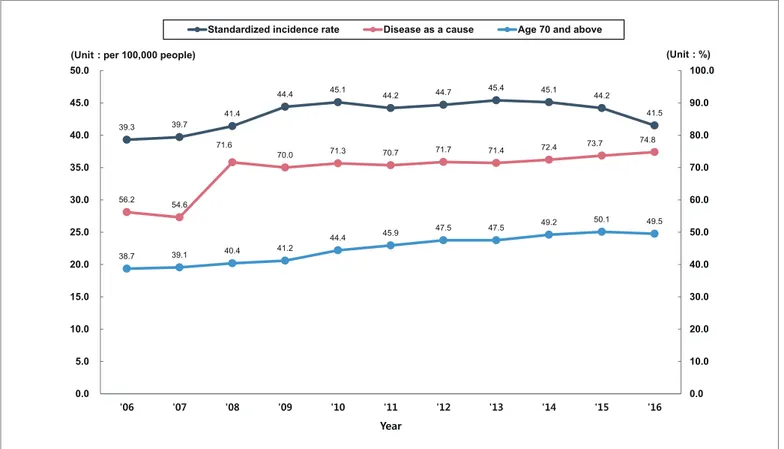
급성심장정지 발생환자 수는 2006년 19,480명에서 2016년
29,832명으로 약 1.5배 증가하였으며, 표준화 발생률은 2006년 인구
10만 명당 39.3명에서 2016년 41.5명으로 약 1.1배 증가하였다. 지난
11년 동안 인구구조가 변화됨에 따라, 급성심장정지 환자의 인구학적
특징도 변화가 있었다. 2006년 급성심장정지 환자의 38.7%이었던
Table 1. General status of sudden cardiac arrest occurrence, 2006-2016
(Unit : Case, per 100 000 people, %)
* Incidence (Standardized): Adjusted to compensate for different population composition in each year and region, by using standard population (2005 future es-timated population, KOSTAT)
Types ' 06 ' 07 ' 08 ' 09 ' 10 ' 11 ' 12 ' 13 ' 14 ' 15 ' 16 Case 19,480 20,353 21,905 24,442 25,909 26,382 27,823 29,356 30,309 30,771 29,832 Incidence (Standardized)* 39.3 39.7 41.4 44.4 45.1 44.2 44.7 45.4 45.1 44.2 41.5 Proportion of people aged
70 years and above 38.7 39.1 40.4 41.2 44.4 45.9 47.5 47.5 49.2 50.1 49.5 Proportion of people where
‘disease’ is a cause 56.2 54.6 71.6 70.0 71.3 70.7 71.7 71.4 72.4 73.7 74.8 39.3 39.7 41.4 44.4 45.1 44.2 44.7 45.4 45.1 44.2 41.5 56.2 54.6 71.6 70.0 71.3 70.7 71.7 71.4 72.4 73.7 74.8 38.7 39.1 40.4 41.2 44.4 45.9 47.5 47.5 49.2 50.1 49.5 0.0 10.0 20.0 30.0 40.0 50.0 60.0 70.0 80.0 90.0 100.0 0.0 5.0 10.0 15.0 20.0 25.0 30.0 35.0 40.0 45.0 50.0 '06 '07 '08 '09 '10 '11 '12 '13 '14 '15 '16 (Unit : %) (Unit : per 100,000 people)
Year
Standardized incidence rate Disease as a cause Age 70 and above
70세 이상 노인 비율은 2016년 49.5%로 크게 증가하였고, 발생
원인이 ‘질병’인 비율도 증가하고 있는 추세이다.
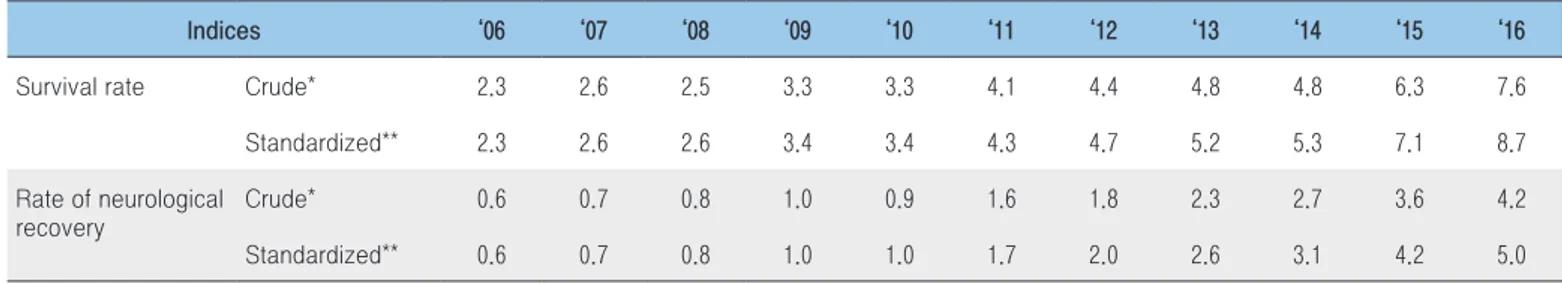
급성심장정지 환자의 생존율과 뇌기능 회복 률 은 매년
증가하였다. 생존율은 2006년 2.3%에서 2016년 7.6%로 약 3.3배
증가하였고, 혼자서 일상생활이 가능할 정도로 뇌기능이 회복된
환자의 비율인 뇌기능 회복률은 2006년 0.6%에서 2016년 4.2%로
7배 증가하였다. 생존율과 뇌기능 회복률 향상의 핵심 요소인
지역사회 일반인 심폐소생술 시행률은 2008년 1.9%에서 2016년
16.8%로 크게 증가하였으며, 매년 증가 추세에 있다. 구급대의
처치 능력을 반영하는 병원 도착 전 자발순환 회복률 또한 2006년
0.9%에서 2016년 6.9%로 7.7배 증가하였다. 일반인 심폐소생술
시행률과 병원 도착 전 자발순환 회복률의 향상은 급성심장정지
환자의 생존율과 뇌기능 회복률 향상에 기여하였다.
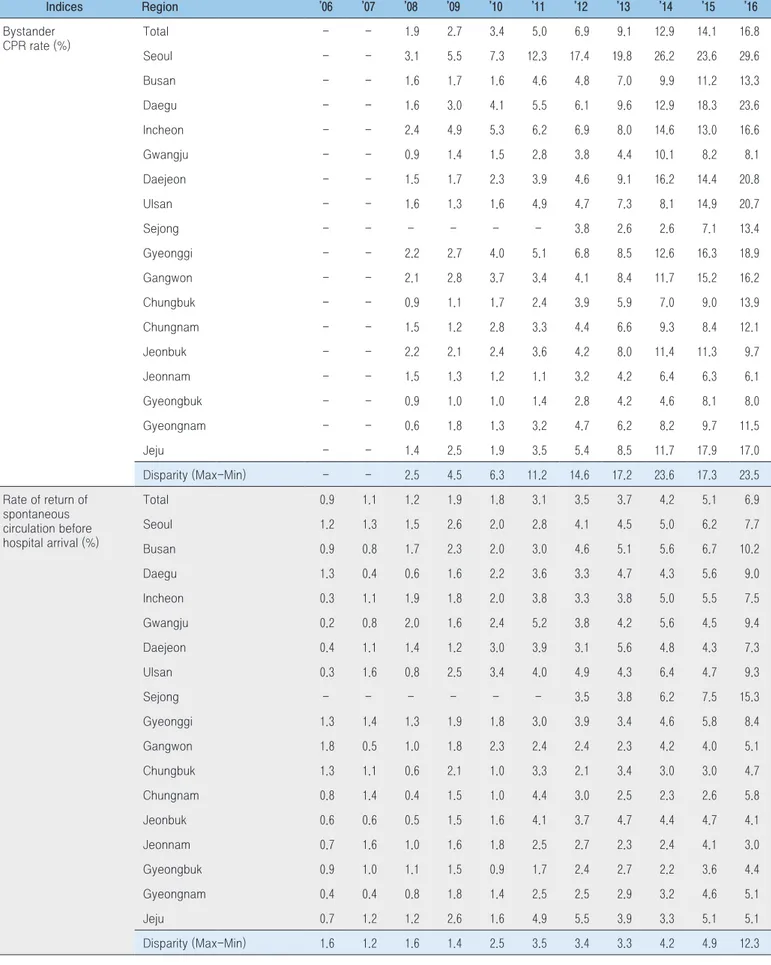
급성심장정지 관련 지역별 현황
급성심장정지와 관련한 주요 지표의 값은 지역 간 큰 격차를
보이고 있다. 이러한 지역 간 격차(최대값-최소값)의 원인은
Table 2. Current status of main indices in sudden cardiac arrests
(Unit : %)
* Survived arrest patients are divided by total arrest patients in the corresponding year, and written in percentage
** Adjusted to compensate for different population composition in each year and region, by using the patients population that suffered the sudden cardiac arrest in 2006
※ From 2015, the result of follow-up studies that confirmed the survival of patients transferred from the emergency room to other hospitals, has been reflected on the statistics
Indices ‘06 ‘07 ‘08 ‘09 ‘10 ‘11 ‘12 ‘13 ‘14 ‘15 ‘16 Survival rate Crude* 2.3 2.6 2.5 3.3 3.3 4.1 4.4 4.8 4.8 6.3 7.6 Standardized** 2.3 2.6 2.6 3.4 3.4 4.3 4.7 5.2 5.3 7.1 8.7 Rate of neurological recovery Crude* 0.6 0.7 0.8 1.0 0.9 1.6 1.8 2.3 2.7 3.6 4.2 Standardized** 0.6 0.7 0.8 1.0 1.0 1.7 2.0 2.6 3.1 4.2 5.0 2.3 2.6 2.5 3.3 3.3 4.1 4.4 4.8 4.8 6.3 7.6 0.6 0.7 0.8 1.0 0.9 1.6 1.8 2.3 2.7 3.6 4.2 0.0 1.0 2.0 3.0 4.0 5.0 6.0 7.0 8.0 '06 '07 '08 '09 '10 '11 '12 '13 '14 '15 '16 (Unit : %) Year
Survival rate Neurological Recovery Rate
Figure 3. Trends in survival rate and neurological recovery
rate
1.9 2.7 3.4 5.0 6.9 9.1 12.9 14.1 16.8 0.9 1.1 1.2 1.9 1.8 3.1 3.5 3.7 4.2 5.1 6.9 0.0 2.0 4.0 6.0 8.0 10.0 12.0 14.0 16.0 18.0 '06 '07 '08 '09 '10 '11 '12 '13 '14 '15 '16 (Unit : %)Rate of bystander CPR Rate of ROSC before hospital arrival
Year
Figure 4. Trends in rate of bystander CPR and rate of
return of spontaneous circulation (ROSC) before hospital
arrival
Table 3. Disparities in sudden cardiac arrest survey main indices, 2006-2016
(Unit : %, %p) Indices Region ’06 ’07 ’08 ’09 ’10 ’11 ’12 ’13 ’14 ’15 ’16 Bystander CPR rate (%) Total - - 1.9 2.7 3.4 5.0 6.9 9.1 12.9 14.1 16.8 Seoul - - 3.1 5.5 7.3 12.3 17.4 19.8 26.2 23.6 29.6 Busan - - 1.6 1.7 1.6 4.6 4.8 7.0 9.9 11.2 13.3 Daegu - - 1.6 3.0 4.1 5.5 6.1 9.6 12.9 18.3 23.6 Incheon - - 2.4 4.9 5.3 6.2 6.9 8.0 14.6 13.0 16.6 Gwangju - - 0.9 1.4 1.5 2.8 3.8 4.4 10.1 8.2 8.1 Daejeon - - 1.5 1.7 2.3 3.9 4.6 9.1 16.2 14.4 20.8 Ulsan - - 1.6 1.3 1.6 4.9 4.7 7.3 8.1 14.9 20.7 Sejong - - - 3.8 2.6 2.6 7.1 13.4 Gyeonggi - - 2.2 2.7 4.0 5.1 6.8 8.5 12.6 16.3 18.9 Gangwon - - 2.1 2.8 3.7 3.4 4.1 8.4 11.7 15.2 16.2 Chungbuk - - 0.9 1.1 1.7 2.4 3.9 5.9 7.0 9.0 13.9 Chungnam - - 1.5 1.2 2.8 3.3 4.4 6.6 9.3 8.4 12.1 Jeonbuk - - 2.2 2.1 2.4 3.6 4.2 8.0 11.4 11.3 9.7 Jeonnam - - 1.5 1.3 1.2 1.1 3.2 4.2 6.4 6.3 6.1 Gyeongbuk - - 0.9 1.0 1.0 1.4 2.8 4.2 4.6 8.1 8.0 Gyeongnam - - 0.6 1.8 1.3 3.2 4.7 6.2 8.2 9.7 11.5 Jeju - - 1.4 2.5 1.9 3.5 5.4 8.5 11.7 17.9 17.0 Disparity (Max-Min) - - 2.5 4.5 6.3 11.2 14.6 17.2 23.6 17.3 23.5 Rate of return of spontaneous circulation before hospital arrival (%) Total 0.9 1.1 1.2 1.9 1.8 3.1 3.5 3.7 4.2 5.1 6.9 Seoul 1.2 1.3 1.5 2.6 2.0 2.8 4.1 4.5 5.0 6.2 7.7 Busan 0.9 0.8 1.7 2.3 2.0 3.0 4.6 5.1 5.6 6.7 10.2 Daegu 1.3 0.4 0.6 1.6 2.2 3.6 3.3 4.7 4.3 5.6 9.0 Incheon 0.3 1.1 1.9 1.8 2.0 3.8 3.3 3.8 5.0 5.5 7.5 Gwangju 0.2 0.8 2.0 1.6 2.4 5.2 3.8 4.2 5.6 4.5 9.4 Daejeon 0.4 1.1 1.4 1.2 3.0 3.9 3.1 5.6 4.8 4.3 7.3 Ulsan 0.3 1.6 0.8 2.5 3.4 4.0 4.9 4.3 6.4 4.7 9.3 Sejong - - - 3.5 3.8 6.2 7.5 15.3 Gyeonggi 1.3 1.4 1.3 1.9 1.8 3.0 3.9 3.4 4.6 5.8 8.4 Gangwon 1.8 0.5 1.0 1.8 2.3 2.4 2.4 2.3 4.2 4.0 5.1 Chungbuk 1.3 1.1 0.6 2.1 1.0 3.3 2.1 3.4 3.0 3.0 4.7 Chungnam 0.8 1.4 0.4 1.5 1.0 4.4 3.0 2.5 2.3 2.6 5.8 Jeonbuk 0.6 0.6 0.5 1.5 1.6 4.1 3.7 4.7 4.4 4.7 4.1 Jeonnam 0.7 1.6 1.0 1.6 1.8 2.5 2.7 2.3 2.4 4.1 3.0 Gyeongbuk 0.9 1.0 1.1 1.5 0.9 1.7 2.4 2.7 2.2 3.6 4.4 Gyeongnam 0.4 0.4 0.8 1.8 1.4 2.5 2.5 2.9 3.2 4.6 5.1 Jeju 0.7 1.2 1.2 2.6 1.6 4.9 5.5 3.9 3.3 5.1 5.1 Disparity (Max-Min) 1.6 1.2 1.6 1.4 2.5 3.5 3.4 3.3 4.2 4.9 12.3Table 3. (Continued) Disparities in sudden cardiac arrest survey main indices, 2006-2016
(Unit : %, %p) Indices Region ’06 ’07 ’08 ’09 ’10 ’11 ’12 ’13 ’14 ’15 ’16 Survival rate (%) Total Crude 2.3 2.6 2.5 3.3 3.3 4.1 4.4 4.8 4.8 6.3 7.6 Standardized 2.3 2.6 2.6 3.4 3.4 4.3 4.7 5.2 5.3 7.1 8.7 Seoul 3.9 5.0 4.9 6.4 6.3 8.3 8.8 9.2 8.6 9.8 11.4 Busan 0.6 2.0 2.0 3.5 3.6 4.5 4.4 5.3 5.7 7.6 9.1 Daegu 2.2 1.3 1.7 2.4 2.4 3.7 4.7 6.1 5.4 5.1 7.0 Incheon 4.3 3.9 4.5 4.1 4.0 5.8 5.3 6.7 5.8 7.2 8.2 Gwangju 3.2 2.0 3.1 4.6 4.0 4.1 2.9 4.6 3.9 7.6 9.2 Daejeon 4.4 3.9 4.2 4.2 8.1 6.6 6.8 7.9 7.3 7.1 8.4 Ulsan 1.4 1.9 0.5 2.7 4.4 3.3 3.8 3.0 4.5 6.4 10.9 Sejong - - - 5.3 2.6 3.7 2.2 11.9 Gyeonggi 3.0 3.4 2.8 3.7 3.3 4.0 4.8 4.8 5.7 6.8 8.2 Gangwon 3.2 2.4 1.9 2.9 4.1 3.1 3.6 3.8 4.5 4.7 6.1 Chungbuk 1.7 1.2 1.4 2.0 1.5 3.0 2.5 3.8 2.8 3.9 5.3 Chungnam 0.3 0.7 0.7 1.2 0.7 2.5 2.6 1.9 1.9 3.5 6.1 Jeonbuk 1.1 2.4 1.2 1.5 2.1 3.0 2.9 4.4 3.2 4.8 5.1 Jeonnam 0.9 1.4 1.4 1.4 1.2 1.7 1.6 1.2 1.1 4.4 4.7 Gyeongbuk 0.7 0.6 1.1 1.3 1.1 1.6 1.4 1.8 1.3 3.4 4.3 Gyeongnam 0.2 0.5 1.9 1.8 1.1 1.6 2.1 2.3 2.6 4.5 5.5 Jeju 1.4 2.7 1.8 3.2 2.8 3.5 4.6 3.6 3.6 7.4 6.2 Disparity (Max-Min) 4.2 4.5 4.4 5.2 7.4 6.7 7.4 8.0 7.5 7.6 7.6 Neurological recovery rate (%) Total Crude 0.6 0.7 0.8 1.0 0.9 1.6 1.8 2.3 2.7 3.6 4.2 Standardized 0.6 0.7 0.8 1.0 1.0 1.7 2.0 2.6 3.1 4.2 5.0 Seoul 0.8 1.6 1.5 1.7 1.6 2.9 3.3 3.9 4.9 5.8 6.0 Busan 0.0 0.4 0.3 1.2 0.8 1.9 2.2 3.0 3.1 4.6 5.3 Daegu 1.1 0.0 0.9 1.1 1.2 2.2 2.3 3.9 3.7 3.7 5.4 Incheon 1.0 1.1 0.8 1.3 1.4 2.1 2.2 3.0 3.8 3.8 4.5 Gwangju 0.2 0.6 0.9 1.1 0.6 2.1 1.6 2.2 2.2 3.7 4.8 Daejeon 1.6 1.5 1.4 0.3 1.4 2.9 1.9 3.8 3.3 3.9 4.0 Ulsan 0.6 1.1 0.3 1.0 2.1 0.9 2.3 1.5 2.6 4.0 6.2 Sejong - - - 1.8 2.6 3.7 0.0 9.3 Gyeonggi 0.8 0.8 0.9 0.9 1.0 1.3 2.1 2.4 2.8 3.8 4.6 Gangwon 1.4 0.9 0.6 1.7 1.4 1.1 1.0 2.1 2.5 2.5 2.5 Chungbuk 0.4 0.3 0.3 1.0 0.6 1.0 0.7 1.4 1.8 2.5 3.1 Chungnam 0.0 0.3 0.0 0.3 0.1 1.1 1.2 0.8 0.9 1.9 2.9 Jeonbuk 0.2 0.1 0.3 0.4 0.4 1.4 1.2 2.0 2.2 2.7 3.3 Jeonnam 0.2 0.1 0.7 0.2 0.3 0.4 0.5 0.6 0.4 2.3 2.0 Gyeongbuk 0.2 0.1 0.3 0.6 0.5 0.6 0.9 0.9 0.8 2.3 2.7 Gyeongnam 0.1 0.2 0.5 0.5 0.4 0.7 1.1 1.5 1.8 2.7 3.1 Jeju 0.5 1.4 0.9 1.7 1.2 2.8 2.7 2.0 2.2 4.6 3.7 Disparity (Max-Min) 1.6 1.6 1.5 1.5 2.0 2.5 2.8 3.3 4.5 5.8 7.3
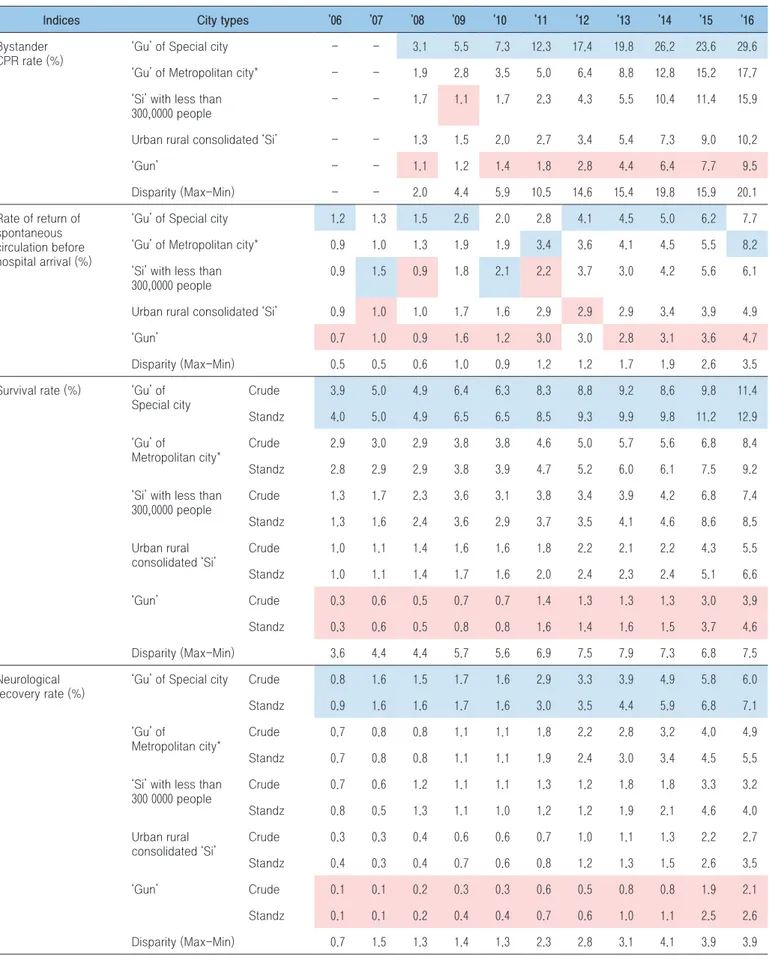
Table 4. Results of sudden cardiac arrest main indices and their disparities among city types, 2006-2016
* ‘Si’ with more than 300,000 population, or ‘Gu’ of ‘Si’ with more than 500,000 population
Region with the highest values in the year Region with the lowest values in the year
Indices City types ’06 ’07 ’08 ’09 ’10 ’11 ’12 ’13 ’14 ’15 ’16 Bystander
CPR rate (%)
‘Gu’ of Special city - - 3.1 5.5 7.3 12.3 17.4 19.8 26.2 23.6 29.6 ‘Gu’ of Metropolitan city* - - 1.9 2.8 3.5 5.0 6.4 8.8 12.8 15.2 17.7 ‘Si’ with less than
300,0000 people
- - 1.7 1.1 1.7 2.3 4.3 5.5 10.4 11.4 15.9 Urban rural consolidated ‘Si’ - - 1.3 1.5 2.0 2.7 3.4 5.4 7.3 9.0 10.2 ‘Gun’ - - 1.1 1.2 1.4 1.8 2.8 4.4 6.4 7.7 9.5 Disparity (Max-Min) - - 2.0 4.4 5.9 10.5 14.6 15.4 19.8 15.9 20.1 Rate of return of spontaneous circulation before hospital arrival (%)
‘Gu’ of Special city 1.2 1.3 1.5 2.6 2.0 2.8 4.1 4.5 5.0 6.2 7.7 ‘Gu’ of Metropolitan city* 0.9 1.0 1.3 1.9 1.9 3.4 3.6 4.1 4.5 5.5 8.2 ‘Si’ with less than
300,0000 people
0.9 1.5 0.9 1.8 2.1 2.2 3.7 3.0 4.2 5.6 6.1 Urban rural consolidated ‘Si’ 0.9 1.0 1.0 1.7 1.6 2.9 2.9 2.9 3.4 3.9 4.9 ‘Gun’ 0.7 1.0 0.9 1.6 1.2 3.0 3.0 2.8 3.1 3.6 4.7 Disparity (Max-Min) 0.5 0.5 0.6 1.0 0.9 1.2 1.2 1.7 1.9 2.6 3.5 Survival rate (%) ‘Gu’ of
Special city Crude 3.9 5.0 4.9 6.4 6.3 8.3 8.8 9.2 8.6 9.8 11.4 Standz 4.0 5.0 4.9 6.5 6.5 8.5 9.3 9.9 9.8 11.2 12.9 ‘Gu’ of Metropolitan city* Crude 2.9 3.0 2.9 3.8 3.8 4.6 5.0 5.7 5.6 6.8 8.4 Standz 2.8 2.9 2.9 3.8 3.9 4.7 5.2 6.0 6.1 7.5 9.2 ‘Si’ with less than
300,0000 people Crude 1.3 1.7 2.3 3.6 3.1 3.8 3.4 3.9 4.2 6.8 7.4 Standz 1.3 1.6 2.4 3.6 2.9 3.7 3.5 4.1 4.6 8.6 8.5 Urban rural consolidated ‘Si’ Crude 1.0 1.1 1.4 1.6 1.6 1.8 2.2 2.1 2.2 4.3 5.5 Standz 1.0 1.1 1.4 1.7 1.6 2.0 2.4 2.3 2.4 5.1 6.6 ‘Gun’ Crude 0.3 0.6 0.5 0.7 0.7 1.4 1.3 1.3 1.3 3.0 3.9 Standz 0.3 0.6 0.5 0.8 0.8 1.6 1.4 1.6 1.5 3.7 4.6 Disparity (Max-Min) 3.6 4.4 4.4 5.7 5.6 6.9 7.5 7.9 7.3 6.8 7.5 Neurological recovery rate (%)
‘Gu’ of Special city Crude 0.8 1.6 1.5 1.7 1.6 2.9 3.3 3.9 4.9 5.8 6.0 Standz 0.9 1.6 1.6 1.7 1.6 3.0 3.5 4.4 5.9 6.8 7.1 ‘Gu’ of
Metropolitan city*
Crude 0.7 0.8 0.8 1.1 1.1 1.8 2.2 2.8 3.2 4.0 4.9 Standz 0.7 0.8 0.8 1.1 1.1 1.9 2.4 3.0 3.4 4.5 5.5 ‘Si’ with less than
300 0000 people Crude 0.7 0.6 1.2 1.1 1.1 1.3 1.2 1.8 1.8 3.3 3.2 Standz 0.8 0.5 1.3 1.1 1.0 1.2 1.2 1.9 2.1 4.6 4.0 Urban rural consolidated ‘Si’ Crude 0.3 0.3 0.4 0.6 0.6 0.7 1.0 1.1 1.3 2.2 2.7 Standz 0.4 0.3 0.4 0.7 0.6 0.8 1.2 1.3 1.5 2.6 3.5 ‘Gun’ Crude 0.1 0.1 0.2 0.3 0.3 0.6 0.5 0.8 0.8 1.9 2.1 Standz 0.1 0.1 0.2 0.4 0.4 0.7 0.6 1.0 1.1 2.5 2.6 Disparity (Max-Min) 0.7 1.5 1.3 1.4 1.3 2.3 2.8 3.1 4.1 3.9 3.9
명확하지 않지만, 지역 간 격차가 증가 추세에 있기 때문에, 지역별
관련 지표를 생산하고 이를 지역사회에 환류해 주는 것이 중요하다.
일반인 심폐소생술 시행률, 병원 도착 전 자발순환 회복률의 지역
간 격차는 모두 증가하였으며, 급성심장정지 치료 결과인 생존율
및 뇌기능 회복률의 지역 간 격차 또한 지속적으로 증가하고 있는
추세이다.
도시유형간 격차에서 일반인 심폐소생술, 병원 도착 전
자발순환 회복, 생존과 뇌기능 회복 등 전체적으로 상당한 격차가
있고, 그 격차는 증가하고 있다. 특히, 서울특별시는 다른 도시유형에
비해서 전반적으로 양호하고, 생존율과 뇌기능 회복률 개선 폭이
다른 도시유형보다 큰 상황이다.
맺는 말
급성심장정지는 치료의 적시성이 매우 중요하며, 지역사회,
구급, 병원 단계가 유기적으로 연결될 때만 환자의 예후를 향상시킬
수 있기 때문에, 급성심장정지 환자의 생존 결과는 해당 국가의
응급의료체계 전체를 평가할 수 있는 시금석이라고 할 수 있다.
2008년 급성심장정지조사 사업 이후, 급성심장정지와 관련된
문제를 객관적으로 파악할 수 있게 되었으며, 지역 간 비교 가능한
지역통계를 생산함으로써 지역 맞춤형 정책이 가능한 근거자료를
제공할 수 있게 되었다. 이를 통해 국가 전체로는 급성심장정지 생존
결과가 향상된 반면, 지역 간 격차는 오히려 더 커지고 있는 문제를
확인할 수 있었다.
최근 발표된 연구 결과[4]에 의하면 지역사회 심폐소생술
교육 경험률이 10% 증가할 때 급성심장정지 환자 생존율이 1.4배
증가한다는 사실이 밝혀졌다. 254개 보건소가 지역보건법에
따라 매년 실시하는 ‘지역사회건강조사(주민건강통계)’의 결과에
따르면, 심폐소생술에 대한 일반 주민의 교육경험이 전반적으로
향상되고 있으나 지역 간 차이를 보인다는 결과[5]를 고려했을 때,
국가 전체의 생존 향상뿐만 아니라 지역 간 격차를 해소하기 위한
중앙정부와 지방정부의 정책 활동 강화가 필요하다. 마지막으로,
급성심장정지조사를 통해 생산하는 지역통계는 급성심장정지
환자의 생존 향상을 위한 지역사회 활동을 크게 촉진하리라
기대한다.
참고문헌
1. Bryan McNally, et al. CARES: Cardiac Arrest Registry to Enhance Survival. Annals of emergency medicine. 54(5)November, 2009. 2. Kunihiro Mashiko, et al. An outcome study of out-of-hospital
cardiac arrest using the Utstein template-a Japanese experience.
Resuscitation. 2002;55:241-246.
3. 질병관리본부, 2006-2016 급성심장정지조사 통계, 2017.
4. Ro YS, et al. Public awareness and self-efficacy of cardiopulmonary resuscitation in communities and outcomes of out-of-hospital cardiac arrest: A multi-level analysis. Resuscitation. 2016;102:17-24. 5. 질병관리본부, 2008-2016 지역건강통계 한눈에 보기, 2017.