행접관행물등록변호
AOO45-65020-57 -9811
훌훌 꿇짧의 탐람뚫활맨짧빼tt톱뿔뿔
編
韓國保健람f 會細究훔훌
植
했
綠
煥
英
勳
世
敬
張
桂
都
高
정치·경제·사회의 발전과 더불어 「삶의 질」 향상에 대한 국민의 관심과 욕구가 높 아지고 있어 보다 효율적인 정책수립에 필요한 다양한 통계가 요구되고 있습니다. 또 한 세계화, 지방화에 따라 관련통계의 요구는 보다 다원화되고 있을 뿐만 아니라 세 분화되어 가는 추세에 있습니다. 따라서 보건복지와 관련된 국민의 관심과 국가의 수 준 등을 보다 체계적으로 정리한 통계를 제공함으로써 정책수립뿐만 아니라 국민의 정보욕구를 충족시켜 줄 수 있을 것입니다. 현재 보건복지관련 통계자료는 관련기관에서 주기적으로 생산하고 있으나 그 내용 은 기관의 사업추진을 위한 목적으로 생산되기 때문에 영역이 제한되어 있는 실정입 니다. 이에 본 연구원에서는 한국의 보건복지 관련지표를 보다 손쉽게 찾아볼 수 있 도록 1996년에 이어 두 번째로 지표집을 발간하게 되었습니다. 이번에는 통계이용자 가 보다 용이하게 접근할 수 있도록 OECD의 분류에 따라 체계화하는데 역점을 두었 습니다. 나아가 가능한 다년간의 자료를 수록함으로써 시계열비교가 가능하도록 노력 하였습니다. 본 지표집은 산재해 있는 보건복지관련 통계표들을 수집 정리하였고, 새로운 신규통 계도 다수 포함하고 있어 정책수립자 및 연구자들이 보다 편리하게 활용할 수 있을 것 입니다. 아무쪼록 보건복지분야에 관섬 있는 모든 분들에게 좋은 참고자료로 활용될 수 있기를 기대합니다. 앞으로 정책 및 연구에 활용성을 높이기 위하여 신규생산통계 및 지역별 통계 등 보다 세분화된 통계자료를 추가 제공할 계획입니다. 향후 보다 향상된 지표집으로의 역할을 다 할 수 있도록 관심 있는 분들의 많은 조언을 기대합니다. 본 지표집에 대해 유익한 조언을 해주신 홍문식 박사 및 이삼식 책임연구원 그리고
Julie
Oh에게 사의를 표하며, 자료입력, 표 및 그림편집에 정판선, 이내연, 정유선, 박 천 연구원의 큰 도움이 있었습니다. 끝으로 본 지표집의 편제, 참고·인용자료의 선정, 연도의 구분, 항목선정 등과 관련된 자의성 등은 자료집 작성자들의 개인적 견해이며 본 연구원의 공식적인 견해나 입장이 아님을 밝협니다. 1998年 12月 韓國保健社會昭究院 院長 鄭 敬 培The people' s aspiration and desire for improved quality of life has been increasing
with socio-economic development.
This has called for the production of various indicators
and statistics that are necessary for formulation of effective policies to fulfill this increased
demand for quality of life.
As globalization and regionalization proceeds
,
the need for
statistics is becoming more diverse and specialized at the same time.
In order to meet
these changes
,
more systematically organized data and information are needed.
Some health and welfare related statistics are being produced periodically in
several organizations.
These statistics
,
however
,
are being produced with the goal of
promoting the organizations' own programs and their scope is limited.
The Korea
Institute for Health and Social Affairs is publishing this collection of indicators for the
second time since 1996.
We focused on systemizing the statistics following OECD
classification. In addition
,
great efforts were made toward making a time-series analysis
possible by collecting information from as many years as possible.
This collection includes various existing and newly produced health and welfare
related statistics and indicators which will further facilitate use for policy formulators or
researchers.
Our hope is that this collection will be of great use to all those that are
involved in the health and welfare field.
In the future
,
we plan to provide more
specialized statistics and information such as regional statistics. We also look forward to
hearing suggestions from our readers to aid in our efforts to enhance the quality of the
collection.
We express our gratitude to Moonshik Hong Ph.D
,
Samshik Lee Ph.D
,
and Julie
Oh for providing valuable suggestions to this collection.
Research assistants
,
Chun Park
,
Naeyon Lee and Yoosun Chung
,
provided great help in inputting and editing the tables.
Finally
,
the composition
,
selection of references
,
classification of years and table titles of
this collection are based solely on the authors personal opinions and are not the official
opinions or positions of this Institute.
December 1998
Kyungbae Chung
President
l.
本 指標集의 대부분은 政府部處 및 國內外 主要機關에서 所藏·發刊한 統計資料를 編輯·統 合한 것으로서, 各 表의 下段에 出處를 明記하였음.2.
計數 중 單位 未滿數는 반올림을 原則으로 한 것이므로 內容과 總數가 一致되지 않는 경우 가 있음.3.
收錄된 資料에 대하여 問議事項이 있을 때에는 資料出處機關이나 韓國保健社會짧究院 情報 統計팀 (02-355-8003) 에 問議하시 기 바람.4.
統計表示上의 符號의 뜻은 다음과 같음. 해당숫자 미상 해당숫자 없음0:
단위미만p:
잠정치1.
The data used in this handbook have been obtained from government agencies and the
other domestic or foreign organizations as shown under each table.
2.
There are some discrepancies between individual statistics and totals because fraction
numbers are rounded off to unit decimals.
3.
Ifthere are any questions
,
please contact Information and Statistics Research Team of
the Korea Institute for Health and Social
Affairs (02-355-8003).
4.
The meanings of the symbols used in the tables are as follows:
: Data not available
-
: Data not applicable
o :
Zero or less than half of the final digit
P
Provìsional
要約
...
……1
주요 統計圖表...
……… ... …………31
表
目
次
1.
人 口
總/\口 〈表1-1-
1) 總人口, 人口成長率, 性比, 人口密度, 北韓人口 :1960-1998 ... 59
〈表1-1- 2)
人口動態申告에 의한 出生 및 死亡 :1970-1997 ... 61
〈表1-1- 3)
將來推計人口, 出生, 死亡 및 人口成長增率 :1995-2030 ...
… ...62
〈표1-1- 4)
人 口 增加指數 :1960-2030 ... 63
〈表1-1- 5)
年央推計人 口 - 性 및 年敵別 :1960-2030 ... 64
〈表1-1- 6)
人 口 住힘總調훌 人 口 - 性 및 年敵別 :1970 ... 72
〈表1-1- 7)
人 口 住흰總調훌 人 口 - 性 및 年敵別 :1975 ... 74
〈表1-1- 8)
Á 口 住흰總調훌 人 口 - 性 및 年敵別 :1980 ... 76
〈表1-1- 9)
人 口 住흰總調호 人 口 - 性 및 年敵別 :1985 ... 78
〈表1-1-10)
人 口 住흰總調훌 人 口 - 性 및 年顧別:1990 ... 80
〈表1-1-11)
人 口 住흰總調호 人 口 - 性 및 年敵別:1995 ... 82
A 口構成 〈表1-2-
1) 人口의 年敵 構成 - 性別 :1970-1995 ... 84
〈表
1-2- 3)
技養比 및 老觀化指數 :1960-2030 ... 88
〈表1-2- 4)
國民平均年敵 - 性別 :1960-2030 ...
9。 〈표1-2- 5)
老人 A 口 構成比率 - 特定 年觀 以上 :1960-2030 ...
와 〈表1-2- 6)
學觀A 口 - 學校級別 :1960-2030 ... 93
〈表1-2- 7)
年觀 3區分 構成比 및 技養比 - 市·道別 :1995 ...
없 A 口分布 〈表1-3-
1) 人 口 住힐總調훌 人 口 - 市· 道 및 性別 :1995 ... 96
〈表1-3- 2)
推計人 口 - 市· 道別 :1970-2020 ... 98
〈表1-3- 3)
人 口, 面積, Á 口 密度 - 市· 道別 :1996 ... 100
出生 〈表1-4-
1) 出生性比 - 出生順位別 :1981 -1997 ... 101
〈표1-4- 2)
出生性比 - 市· 道別 :1987 -1997 ... 102
〈表1-4- 3)
有配偶歸人 平均出生兒數 :1988-1997 ... 103
〈表1-4- 4)
年敵別 出옳率 및 合計出뚫率 :1960-1996 ... 104
〈表1-4- 5)
年敵別 有配偶出뚫率 :1960-1996 ... 104
〈表1-4- 6)
15-44歲 有配偶歸人의 趙姐實錢率 - 主要 特性別 :1976-1997 ... 105
〈表1-4- 7)
15-44歲 有配偶歸人의 人工짧娘中總 經驗率 :1976-1997 ... 106
〈表1-4- 8)
15-44歲 有配偶歸人의 特性別 따娘終結形態別 平均며數 ...107
〈表1-4- 9)
15-44歲 有配偶歸人의 最終出뚫兒(1995-1997. 5月 期間중)의 分煥場所 - 母의 主要 特性別 ... ‘ ...108
〈表1-4-10)
出뚫 11頂位別 出生構成 ...109
〈表1-4-11)
出옳順位別 母의 平均年歐 ...109
死亡 〈表1-5-
1) 年敵別 死亡率 - 男子 :1988-1997 ... 110
〈表1-5- 2)
年敵別 死亡率 - 女子 :1988-1997 ... 111
〈表
1-6-
1>
國內 A 口移動率 - 市·道別 :1975-1995 ... 112
2.
家 口
家口構成 〈表2-1-
1>
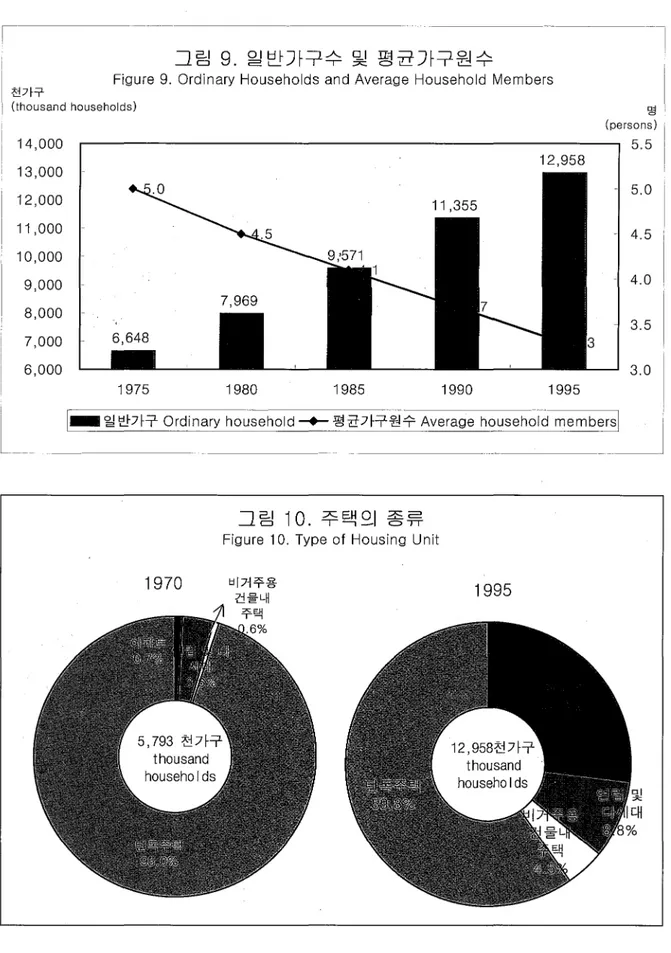
-般家口의 平均 家口員數 및 家口數 :1970-1995 ...
…117
〈表2-1- 2>
家族의 形態別 分布 :1970-1995 ... 117
〈表2-1- 3>
-般家口의 家口主數 및 構成比 - 性 및 年敵別 :1975-1995 ... 118
〈表2-1- 4>
-般家 口 의 世代構成 :1975-1995 ... 120
〈表2-1- 5>
女性家 口主의 家 口 比率 :1975-1995 ...
…121
〈表2-1- 6>
偏父母家 口 比率 :1985-1995 ... 121
家族形成 〈表2-2-
1>
平均 初婚 離婚 및 再婚年敵 :1987-1997 ... 122
〈表2-2- 2>
婚뼈形態別 婚뼈構成比 :1988-1997 ... 122
〈表2-2- 3>
婚뼈率 및 離婚率 :1970-1997 ... 123
〈表2-2- 4>
同居期間別 離婚率 :1988-1997 ... 124
〈表2-2- 5>
離婚事由 :1988-1997 ...
…124
〈表2-2- 6>
15歲 以上 人口의 婚뼈狀態別 構成比 - 性別 :1970-1995 ... 125
〈表2-2- 7>
15세 以上 人 口 의 婚뼈狀態 및 構成比 - 性 및 年敵別 :1995 ... 126
〈表2-2- 8>
15-49歲 人 口 의 有配偶率 - 性 및 年敵別 :1960-1995 ... 128
〈표2-2- 9>
15-44 세 有配偶歸人의 現存子女數 - 主要 特性別 :1997 ... 130
- 年敵別 :
1976-1997 ... 131
家族生活 〈表2-3-
1) 老後準備方法 :1983-1994 ... 132
〈表2-3- 2)
父母의 生計技養 :1994 ...
…133
〈表2-3- 3)
父母의 老後 技養責任에 對한 態度 :1983-1994 ... 134
〈表2-3- 4)
춤少年의 苦問에 대한 見解 :1984-1994 ... 135
〈表2-3- 5)
65歲 以上 老人의 收入源(複數應答) - -般特性別 :1998 ... 136
〈表2-3- 6)
65歲 以上 老人의 現在의 主觀的 健康狀態 - 性·年敵別 :1998 ... 137
〈表2-3- 7)
65歲 以上 老人의 經濟的 技養者 分布(複數應答)-
地域, 年離, 性別 :1998 ... 138
〈表2-3- 8)
65歲 以上 老人의 就業 與否 - 地域·敎育水準別 :1998 ... 139
〈表2-3- 9)
65歲 以上 現 就業 老人의 就業 持續希望 與否 - 地域·敎育水準別 :1998 ... 139
〈表2-3-10)
65歲 以上 老人의 老人福社서 비 스에 대 한 認知度, ...140
利用經驗率, 向後 利用希望率 및 滿足度 :1998
〈表2-3-11)
65歲 以上 老人의 老父母 技養責任者에 대 한 意見 - -般特性別 :1998 ... 142
〈表2-3-12)
65歲 以上 老人의 老後生活費 마련 責任者 - -般特性別 :1998 ... 143
3.
國民健康
壽命 및 保健指標 〈表3-1-
1) 期待餘命 - 年敵別 :1970-1995 ... 146
〈表3-1- 2)
몇兒死亡率 :1970-1996 ... 148
〈表3-1- 3)
몇兒死亡率 - 性別 및 母의 年敵別 : 1993年 出生 ...148
〈表3-1- 4)
生存期間5JJj 몇兒死亡 : 1993年 出生 ...149
〈表
3-1- 6)
母性死 t 比, 母性死亡率, 母性死亡分率 :1995
,1996 ... 150
〈表3-1- 7)
生灌母性死亡危險 :1995
,1996 ... 150
〈表3-1- 8)
母性死亡原因 :1995
,1996 ... 151
훌病, 傷害 및 死亡 〈表3-2-
1) 2週間 有病率 活動制限 日 數 및 歐病 日 數 :1989-1995 ... 152
〈表3-2- 2)
主要 成人病뽑、 有病率 :1995 ... 153
〈表3-2- 3)
癡 有病者數 및 有病率 - 器官 및 性別 :1992 ... 154
〈表3-2- 4)
뿜病의 有病者數 및 有病率 - 性 및 年觀別 :1992 ... 156
〈表3-2- 5)
結陽觀의 有病者數 및 有病率 - 性別 및 年敵別 :1992 ... 157
〈表3-2- 6)
直陽햄의 有病者數 및 有病率 - 性別 年敵別 :1992 ... 158
〈表3-2- 7)
ij千}흙의 有病者數 및 有病率 - 性別 年觀別 :1992 ... 159
〈表3-2- 8)
뼈癡의 有病者數 및 有病率 - 性別 年顧別 :1992 ... 160
〈表3-2- 9)
造血器官 盧의 有病者數 및 有病率 - 性別 年敵別 :1992 ... 161
〈表3-2-10)
뼈 및 關節軟骨 햄의 有病者-數 및 有病率 - 性別 年敵別 :1992 ... 162
〈表3-2-11)
皮鷹癡의 有病者數 및 有病率 - 性別 年敵別 :1992 ... 163
〈表3-2-12)
¥L 房潤의 有病者數 및 有病率 - 性別 年觀別 :1992 ... 164
〈表3-2-13)
子宮햄 및 子宮類部癡의 有病者數 및 有病率 - 年敵別 :1992 ... 165
〈表3-2-14)
主要 死亡原因別 死亡率 - 性別 :1988-1997 ... 166
〈表3-2-15)
交通事故 發生 및 死亡者數 :1970-1995 ... 168
〈表3-2-16)
5大 死因順位別 死亡者數 및 死亡率 - 年觀別 :1997 ... 170
〈表3-2-17)
男子의 5大 死因順位別 死亡者數 및 死亡率 - 年敵別 :1997 ... 171
〈表3-2-18)
女子의 5大 死因順位別 死亡者數 및 死亡率 - 年敵別 :1997 ... 172
〈表3-2-19)
推定 癡果老人數 및 有病率 - 市· 道別 :1995 ... 173
〈表3-2-20)
推定 癡果老人數 - 年敵別 :1995-2020 ... 173
保健意識行態 〈表3-3-
1) 吸煙人口比率 :1989-1995 ... 174
〈表3-3- 2)
餘酒人口比率 :1986-1995 ... 175
〈表3-3- 3)
餘酒者의 過飯며數 :1986-1995 ... 176
〈表
3-3- 5)
健康管理方法 :1986-1995 ... 178
保健管理 〈表3-4-
1) 動勞者의 健康該斷 受檢率 및 職業病 有病動勞者 比率 :1970-1997 ... 179
〈表3-4- 2)
最終出옳兒(1990-1994. 5月)에 대한 接種率 - 地域, 母의 敎育水準 및 f象防接種種類、別 ...180
營養 〈表3-5-
1) 營養供給量 - 1 人1
日 當 :1975-1997 ... 181
〈表3-5- 2)
食品供給量 - 1 人1
日 當 :1975-1997 ... 182
身體發達 〈表3-6-
1) 學生의 身長 - 年般別 :1975-1997 ... 183
〈表3-6- 2)
學生의 體重 - 年敵別 :1975-1997 ... 184
〈表3-6- 3)
學生의 身體重量指數 - 年敵別 :1975-1997 ... 185
〈表3-6- 4)
學生의 가슴둘레 - 年廠別 :1975-1997 ... 186
4.
保健醫據資源
醫擾施設 〈表4-1-
1) 病·醫院數 - 病·醫院 種別 :1980-1997 ... 188
〈表4-1- 2)
人口 10萬名當 病·醫院數 - 病·醫院 種別 :1980-1997 ... 190
〈表4-1- 3)
病 醫院數 - 病· 醫院 種別 :1997 ... 192
〈表
4-1- 5)
入院該爆 病皮數 - 病·醫院 種別 :1980-1997 ... 196
〈表4-1- 6)
人口 10萬名當 病皮數 - 病·醫院 種別 :1980-1997 ... 198
〈表4-1- 7)
病皮數 - 病· 醫院 種別 :1997 ... 200
〈表4-1- 8)
人口 10萬名當 入院該驚 病皮數 - 病·醫院 種別 :1997 ... 202
〈表4-1- 9)
保健所, 保健支所, 保健該橫所 分布現況 :1975-1997 ... 204
〈表4-:-1-10)
應急醫獲機關 指定 現況 :1995-1997 ... 205
〈表4-1-11)
血滾院 改設 現況 :1985-1997 ... 206
〈表4-1-12)
醫藥品, 醫驚用具 등 飯賣業所數 :1980-1997 ... 207
保健醫擾 A 力 〈表4-2-
1) 醫師 免許登錄 狀況 :1975-1997 ... 208
〈表4-2- 2)
園科醫師 免許登錄 狀況 :1975-1997 ... 208
〈表4-2- 3)
韓醫師 免許登錄 狀況 :1975-1997 ... 209
〈表4-2- 4)
藥師, 助塵師, 看護師 免許 및 分野別 看護師, 看護助務師 資格登錄 狀況 :1975-1997 ... 209
〈表4-2- 5)
專門醫 資格登錄 狀況 :1975-1997 ... 210
〈表4-2- 6)
醫擔技士 등 資格登錄 狀況 :1975-1997 ... 210
〈表4-2- 7)
醫廳 A 등 國家試驗 實施 現況 :1975-1997 ... 212
〈表4-2- 8)
專門醫 資格試驗 :1975-1997 ... 214
〈表4-2- 9)
病醫院人力現況 :1981-1997 ...
……216
〈表4-2-10)
人口 10萬名當 病·醫院 A 力現況 :1981-1997 ... 217
〈表4-2-11)
病· 醫院人力現況 - 病· 醫院 種別 :1997 ... 218
〈表4-2-12)
人口 10萬名當 病·醫院 A 力現況 - 病·醫院 種別 :1997 ... 220
〈表4-2-13)
保健所 人力現況 :1985-1997 ... 222
〈表4-2-14)
保健支所 및 保健該據所 人力現況 :1985-1997 ... 224
〈表4-2-15)
醫續人力數 :1984-1997 ... 225
〈表4-2-16)
醫廳人力 1 人當 人口數 :1984-1997 ... 226
醫薦利用 〈表4-3-
1)1
日 平均在院愚、者數 및 平均入院 日 數 :1970-1997 ... 227
〈表
4-3- 3>
病皮利用率 - 所有別, 病練別 :1970-1997 ... 230
〈表4-3- 4>
該驚者數 및 治擾日數 - 調훌直前 2週間 :1989 -1995 ... 231
〈表4-3- 5>
入院· 外來愚者數 및 構成比 - 醫標機關種別 :1994 ... 232
〈表4-3- 6>
人口 10萬名當 外來愚者 受該率 - 傷病分類別, 性別 :1992
,1994 ... 233
〈表4-3- 7>
人口 10萬名當 外來愚者 受該率 - 醫橫機關種別, 居住 市·道別 :1994 ... 234
〈表4-3- 8>
傷病別 退院愚、者 平均入院 日 數 :1992
,1994 ... 235
〈表4-3- 9>
주요 慢性돗愚 平均入院日數 :1990-1994 ... 236
〈表4-3-10>
醫鷹서 비 스에 대 한 滿足度 :1995 ... 238
〈表4-3-11>
醫爆서 버 스에 대 한 不滿理 由 :1995 ... 239
5.
公共技助
生活保護 〈表5-1-
D
公共控助人 口 :1990 -1997 ... 243
〈表5-1- 2>
生活保護對象家口主의 特性 및 現況 :1991 -...1997 ... 244
〈表5-1- 3>
生活保護對象者의 施設保讀 現況 :1997. 1 ... 246
〈表5-1- 4>
生活保護對象者의 自 活可能性 :1996 ... 247
〈表5-1- 5>
生活保護對象者의 就業狀態:1996 ...
……248
〈表5-1- 6>
生活保護對象家 口 의 自 活 ffl펼年數 :1996 ... 249
〈表5-1- 7>
生活保護對象者 敎育狀態 :1996 ... 249
〈表5-1- 8>
生活保護者의 保護事業휩績 - 事業內容別 市·道別 :1985-1997 ... 251
〈表5-1- 9>
生活保護對象家口主의 住흰 所有現況 :1991 -1997 ...
………252
醫薦保護 〈表5-2-
D
全願無料醫據保護對象者 現況 :1992-1997 ... 253
〈表
5-2- 3>
醫廳保護對象者 現況 - 年觀別 性別 :1992 -1997 ... 255
〈表5-2- 4>
醫驚保護事業實績 :1980-1997 ... 256
國家報勳 〈表5-3-
D
國家報勳對象家口 現況 :1990-1996 ... 259
〈表5-3- 2>
國家報勳對象者의 醫續保護者 現況 :1962 -1996 ... 260
〈表5-3- 3>
國家報勳 對象者의 報慣金支給現況 - 對象者別 :1985-1996 ... 261
〈表5-3- 4>
國家報動對象者의 補裝具 需要 및 支給現況 :1991 -1996 ... 262
〈表5-3- 5>
國家報勳對象家口의 學資金支給 現況 :1982-1996 ... 264
6.
社會保險
醫擾保險 〈表6-1-
D
醫爆保險 適用 A 口 保險種類別 市道別 :1980-1997 ... 266
〈表6-1- 2>
公務員 및 私立學校 敎職員醫據保險 適用 A 口 - 市道別 :1980-1997 ... 268
〈表6-1- 3>
職場 및 地域 醫鷹保險組合數 및 適用人口 - 市道別 :1985-1997 ... 270
〈表6-1- 4>
醫驚保險 財政收支 現況 - 保險種類別 :1985-1997 ... 272
〈表6-1- 5>
職場醫廳保險 財政收支 現況 :1985-1997 ... 272
〈表6-1- 6>
公務員 및 私立學校敎職員등 醫驚保險 財政收支 現況 :1985-1997 ... 273
〈表6-1- 7>
地域醫續保險組合 財政收支 現況 :1985-1997 ... 273
〈表6-1- 8>
醫爆保險 給與實績 - 給與種類別 :1985 -1997 ... 274
〈表6-1- 9>
醫爆保險 負擔願 및 給與觀 - 市道別 :1985-1997 ... 276
〈表6-1-10>
醫擁保險 給與實績 - 給與種類別 保險種類別 :1997 ... 277
〈表
6-2-
1) 公的年金 加入者現況 :1980-1996 ... 278
〈表6-2- 2>
國民年金 一般 加入者 現況 - 總括 :1988-1997 ... 279
〈表6-2- 3>
國民年金 特珠職種 動勞者 및 外國人別 加入者 現況:1988-1997 ... 279
〈表6-2- 4>
國民年金 加入者 現況 年敵別, 性別 :1990-1997 ... 280
〈表6-2- 5>
國民年金 加入者 現況 - 業種別 :1990-1997 ... 282
〈表6-2- 6>
國民年金 加入者의 標準所得 月願別 分布 現況 - 45等級別 :1995-1997 .. 284
〈表6-2- 7>
國民年金 給與支給 現況 給與種類別 :1988-1997 ... 286
〈表6-2- 8>
國民年金 基金造成 現況 :1988-1997 ... 289
〈表6-2- 9>
國民年金 基金運用 現況 :1988 -1997 ... 290
〈表6-2-10>
公務員年金法 適用對象者 現況 :1982-1997 -
總括 ...…
...
291
〈表6-2-11>
公務員年金 給與支給 現況 :1993 -1997 ... 292
〈表6-2-12>
公務員年金 支給銀 - 月平均 :1988-1997 ... 294
〈表6-2-13>
公務員年金 基金運用 現況 :1982 -1997 ... 295
〈表6-2-14>
私學年金 對象者 現況 :1975 -1997 ... 296
〈表6-2-15>
私學年金 給與 支給 現況 - 總括 :1991 -1997 ... 298
〈表6-2-16>
私學年金 給與支給 現況 - 年金 :1982 -1997 ... 300
〈表6-2-17>
私學年金 負擔金徵收 現況 :1992-1997 ... 302
〈表6-2-18>
私學年金 基金造成現況 :1975-1997 ... : ... 303
훌 fi; 保險 〈表6-3-
1) 盧業χ害補借保險 適用事業體數 및 動勞者數 - 옳業別 :1989 - 1996 ... 304
〈表6-3- 2>
塵業짜害補慣保險 適用動勞者數 :1970-1996 ... 306
〈表6-3- 3>
處業%害補합保險 給與支給領 - 給與種類別 :1975 -1996 ... 307
〈表6-3- 4>
않業핑害 發生現況 :1975-1996 ... 308
〈表6-3- 5>
앓業짜害補합保險 給與 支給件數 給與種類別 :1975-1996 ... 312
〈表6-3- 6>
Jj~ 害度數率, 핑害彈度率 및 X 害萬人率 :1970-1997 ... 313
〈表
6-4-
1) 흩爛保險 適用現況 - 總括 :1997 ...
“ ...314
〈表6-4- 2)
塵爛保險 適用現況 - 地域別 :1995-1997 ... 315
〈表6-4- 3)
塵購保險 適用現況 - 塵業別 :1995 -1997 ... 316
〈表6-4- 4)
塵健保險 基金運用 實績 :1997 ... 317
〈表6-4- 5)
展情保險 適用事業場數 - 從事A員 規模 및 뚫業別 :1997 ... 318
〈表6-4- 6)
屬情保險 給與支給 實績 :1995-1998
“-… ...
320
7.
社會福社서
비 스
-般社會福社 〈表7-1-
1) 社會福社 施設別 施設數, 平均 收容A員 및 從事者數 :1980-1996 ... 323
〈表7-1- 2)
社會福社 施設數 및 收容人員 - 施設種類別 :1985-1997 ... 324
〈表7-1- 3)
社會福社館數 :1985-1997 ... 325
〈表7-1- 4)
社會福社師 資格證 交付者數 :1980-1997 ... 326
女性福社 〈表7-2-
1) 母子保護 施設收容現況 :1975-1997 ...
“ ...328
〈表7-2- 2)
女性相談 實施現況 :1975-1997 ... 330
老 A 福社 〈表7-3-
1) 老人福社 施設收容現況 :1975-1997 ... 332
〈表
7-3- 3>
60歲 以上 就業 老人의 就業現況 - 性別, 年顧別, 職種別 :1994 ... 335
〈表7-3- 4>
老人健康該斷 및 就業幹旅 實績 :1985-1997 ... 336
障@흉 A 福社 〈表7-4-
D
推定 在家障體人數 - 地域別, 性別, 年觀別 :1995 ...
c ..337
〈表7-4- 2>
障碼人福社 施設 收容現況 :1985-1997 ... 338
〈表7-4- 3>
障陽人 補裝具 交付實績 :1985-1997 ... 340
〈表7-4- 4>
障짧人 就學者數 :1990-1998 ... 341
〈表7-4- 5>
登錄障陽人數 및 義務塵健 遭守業體數 :1990-1997 ... 342
〈表7-4- 6>
在家障隔A 就業率 및 就業希望率 - 性別, 年顧別 :1995 ... 342
兒童福社 〈表7-5-
D
要保護兒童 發生 및 保護現況 :1990-1997 ... 343
〈表7-5- 2>
兒童福社 施設收容現況 :1980-1997 ... 344
〈表7-5- 3>
兒童入養現況 :1990-1997 ... 346
〈表7-5- 4>
少年·少女 家長 世帶 現況 :1985-1997 ... 347
〈表7-5- 5>
保育施設 및 保育兒童現況 :1990-1997 ... 348
浮浪人福社 〈表7-6-
D
浮浪 A 收容施設 및 收容 A員 現況 :1985-1997 ... 350
〈表7-6- 2>
成人 浮浪人 收容施設數 및 收容人員 現況 ‘:1985-1997 ...
…352
〈表7-6- 3>
兒童 浮浪 A 收容施設數 및 收容人員 現況 :1985-1997 ... 354
其他福피止 〈表7-7-
D
懶愚者 登錄現況 :1975 -1997 ... 356
〈表7-7- 2>
精神흉愚者 樓養 施設 收容現況 :1985-1997 ... 358
經濟活動 〈表
8-1-
1) 經濟活動A 口 - 15歲以上人 口, 經濟活動參加率, 就業率, 失業率 :1980-1997 ... 362
〈表8-1- 2)
就業者 構成比 - 職業別 :1980-1997 ... 364
〈表8-1- 3)
女性就業者 構成比 婚뼈狀態別 :1980-1997 ... 365
〈表8-1- 4)
就業者중 55歲 以上 比率 - 性別 및 農·非農家別 :1970-1997 ... 366
〈表8-1- 5)
就業者중 55歲 以上 比率 - 塵業別 :1970-1997 ... 367
〈表8-1- 6)
長期動續者 比率 - 性別 :1980-1997 ... 368
〈表8-1- 7)
離職率 :1970 -1996 ... 369
〈表8-1- 8)
離職事 由 :1997 ... 370
〈表8-1- 9)
依願退職者의 離職事 由 :1997 ...
원1 〈表8-1-10)
失業率 - 性別, 農·非農家別 :1970-1997 ... 372
〈表8-1-11)
失業率 - 數育程度別, 性別 :1980-1997 ... 373
家口所得 및 支出 〈表8-2-
1) 月所得 階層別 家口 分布 :1988-1996 ... 374
〈表8-2- 2)
都市動勞者 家口 月平均所得의 源良別 構成 :1976-1997 ... 375
〈表8-2- 3)
都市動勞者 家口의 月評均 消費支出 構成 :1976-1997 ... 376
〈表8-2- 4)
農家의 月平均 所得 및 消費支出 :1975 -1997 ... 378
〈表8-2- 5)
흩金水準 - 職種別 :1975-1997 ... 380
〈表8-2- 6)
貨金水準 - 옳業別 :1975-1997 ... 382
〈表8-2- 7)
敎育程度別 貨金水準 :1980 -1996 ... 384
〈表8-2- 8)
性別 홉金, 動續年數, 動勞時間 格差 및 離職率比 :1975-1997 ...
…385
〈表
8-3-
1) 大氣, 水質 및 海水펀梁度 :1990-1997 ... 386
〈表8-3- 2>
主要都市 購音公害度 :1995-1997 ... 387
9.
財政
및 經濟
保健福파II:f象算 〈表9-1-
1) 社會保障費支 出 推移 :1990-1996 ... 391
〈表9-1- 2>
保健福社 據算關聯 指標 :1993-1997 ... 392
〈表9-1- 3>
保健福피Il:部 據算 現況 :1993-1998 ... 393
〈表9-1- 4>
中央政府歲出 대비 社會保障 福社部門歲出 :1980-1997 ... 394
〈表9-1- 5>
社會福社事業 基金造成 및 運用現況 :1985-1997 ... 396
〈表9-1- 6>
社會保障財源 :1970-1994 ... 397
主要經濟指標 〈表9-2-
1)GNP
,
GDP
및 1 인당GNP : 1970-1997 ... 398
〈表9-2- 2>
地域內 總生塵 및 生뚫構造 :1995-1996 ....
, •••••••.•.•••..••.••••••••.••.••.•••••••.••.•.••••••••.•••• 않910.
OECD 國家의 保健統計
〈表10-
1) 總A 口 :1960-1997 ... 403
〈表
10- 3)
人口規模의 國家別 百分率 分布 :1960-1997 ...
때5 〈表10- 4)
0-4歲 人口比率 :1960-1997 ... 406
〈표10- 5)
0-19歲 A 口比率 :1960-1997 ... 407
〈표10- 6)
65歲以上 人 口 比率 :1960-1997 ... 408
〈表10- 7)
技養比 (20-64歲 A 口 基準) :1960-1997 ...
때9 〈表10- 8)
A
口 의 中位年觀 :1960-1997 ... 410
〈表10- 9)
몇兒死亡率(出生 1 ,000名當) :1960-1997 ... 411
〈表10-10)
出生率(人口 1 ,000名當) :1960-1997 ... 412
〈表10-11)
死亡率(人口 1 ,000名當) :1960-1997 ... 414
〈表10-12)
標準化 死亡率(人口 1 ,000名當) :1960 -1997 ... 416
〈表10-13)
周庫期 死亡率 :1960-1997 ... 418
〈表10-14)
母性死亡比(出生 1 ,000名當) :1960-1997 ...
쇠9 〈表10-15)
癡에 의한 死亡率(人口 10萬名當) :1960 -1997 ... 420
〈表10-16)
交通事故에 의한 死亡率 (A 口 10萬名當) :1960-1997 ... 421
〈表10-17)
男子 O歲의 期待餘命 :1960-1997 ...
컴2 〈表10-18)
女子 O歲의 期待餘命 :1960-1997 ...
쟁3 〈表10-19)
男子 40歲의 期待餘命 :1960-1997 ... 424
〈表10-20)
女子 40歲의 期待餘命 :1960-1997 ...
쟁5 〈表10-2
1>
男子 65歲의 期待餘命 :1960-1997 ... .
1.
Population
Total Population
Table 1-1 -
1.Population Rate of Increase
,
Sex Ratio
,
Population Density and
Population of North Korea :
1960-1998 ... 59
Table
1-1- 2. No. of Births and Deaths Based on Vital Registration : 1970-1997 ... 61
Table 1-1- 3. Estimated Population
,
Births
,
Deaths and Population Growth Rate
: 1995-2030 ... 62
Table
1-1- 4. Population Increase Index : 1960-2030 ...
:.…… ...63
Table
1-1- 5. Estimates of Midyear Population by Sex and Age : 1960 - 2030 ... 64
Table 1 -1 - 6. Population Based on Population and Housing Census Report
by Sex and Age :
1970 ... 72
Table
1-1- 7. Population Based on Population and Housing Census
by Sex and Age :
1975 ... 74
Table 1-1 - 8. Population Based on Population and Housing Census
by Sex and Age :
1980 ...
… ... …76
Table 1-1- 9. Population Based on Population and Housing Census
by Sex and Age :
1985 ... 78
Table 1-1-10 9. Population Based on Population and Housing Census
by Sex and Age :
1990 ...
… ...80
Table
1-1-1
1.Population Based on Population and Housing Census
Table 1-2-
1.Age Composition of Population by Sex : 1970-1995 ... 84
Table 1-2- 2. Sex Ratio by Age : 1970 -1995 ... 86
Table 1-2- 3. Dependency Ratio
,
Ageing Index : 1960-2030 ... 88
Table 1-2- 4. Mean Age of Population by Sex : 1960-2030 ... 90
Table.1-2- 5. Proportion of Elderly : 1960-2030 ... 91
Table 1-2- 6. Student Population by Level of Education : 1960-2030 ... 93
Table 1-2- 7. Composition by Age(3 Divisions) and Dependency Ratio : 1995 ... 94
Population Distribution
Table 1-3-
1.Population by Census by City
/P
rovince and Sex : 1995 ... 96
Table 1-3- 2. Estimated Population by City/Province : 1970-2020 ... 98
Table 1-3- 3. Population Composition
,
Area
&
Density by Province : 1996 ... 100
Birth
Table 1-4-
1.Sex Ratio at Birth by Birth Order : 1981 -1997 ... 101
Table 1-4- 2. Sex Ratio at Birth by City
/P
rovince : 1987-1997 ... 102
Table 1-4- 3. The Number of Births per Currently Married Woman : 1988-1997 ... 103
Table 1-4- 4. Age Specific Fertility and Total Fertility Rate : 1960-1996 ... 104
Table 1-4- 5. Marital Fertility Rates by Age : 1960-1996 ... 104
Table 1-4- 6. Contraceptive Practice Rates for Currently Married Women Aged 15-44
by Characteristic : 1976 -1997 ... 105
Table 1-4- 7. Induced Abortion Rates for Married Women Aged 15-44 : 1976-1997 .... 106
Table 1-4- 8. Pregnancy Results of Currently Married Women Aged 15-44 ... 107
Table 1-4- 9. The Place of Delivery for the Last Birth0995- May 1997) experienced
by Major Characteristics of Currently Married W omen ... 108
Table 1-4-10. Composition by Birth Order
.“…….“…….“…….“…….“…… …….“…… •• •• …… •• …… •• …… …… •• …… •• •• …… •• …… •• …… …… •• …… •• …… •• •• …… •• …….“…….“…… …… •• … •• ••• …….“…… •• …….“…….“…….“…….“…… •• …….“…….“…… •• …….“…….“…….“…….“…….“…….“…….“…… •• …….“…….“…….“…… …… •• …… •• •• …… …… •• …… •• •• …… …… •• …… •• •• …… …… •• •• …….“…….“…… …… •• •• …….“… ••• …… …… •• …….“…….“…… •• •• …….“…….“…….“….“ ••• “…… •• …….“…….“…… …….“….“••.109
Table 1-5-
1.Age Specific Death Rate - Male : 1988-1997 ... 110
Table 1-5- 2. Age Specific Death Rate - Female : 1988-1997 ... 111
Migration
Table 1-6-
1.Intemal Migration Rate by City
!P
rovince : 1975-1995 ... 112
2. Household
Household Structure
Table 2-1-
1.Mean Number of Household Members and Number of
Ordinary Households : 1970 -1995 ... 117
Table 2-1- 2. Relatives in Households by Type of Family : 1970 -1995 ...
……117
Table 2-1- 3. The Number and Composition of Heads of Ordinary Households
by Sex and Age : 1975-1995 ... 118
Table 2-1- 4. Generations in Households
1975-1995 ... 120
Table 2-1- 5. Percentage of Female Headed Households ; 1975 -1995 ... 121
Table 2-1- 6. Percentage of Single Parent Families : 1985-1995 ... 121
Family Formation
Table 2-2-
1.Mean Age at First Marriage
,Divorce
,and Remarriage : 1987 -1997 ... 122
Table 2-2- 2. Composition of Marriage by Previous Marital Status : 1988-1997 ... 122
Table 2-2- 3. Marriage Rate and Divorce Rate : 1970 -1997 ... 123
Table 2-2- 4. Divorce Rate by Duration of Marriage : 1988-1997 ... 124
Table
2-2- 6. Marital Status of Persons 15 Years Old or Over by Sex : 1970 -1995 ... 125
Table
2-2- 7. Marital Status of Persons 15 Years Old or Over
by Sex and Age
1995 ... 126
Table
2-2- 8. Currently Married Rate of Population Aged 15 to 49
by Sex and Age :
1960 -1995 ...
“ ...128
Table .2-2- 9. No. of Children of Married Women Aged 15-44
by Characteristics :
1997 ... 130
Table
2-2-10. Expected
&
Ideal Number of Children for Curretly
Married Women :
1976-1997 ... 131
Family Life
Table
2-3-
1.Methods of Preparation for Old-age :
1983-1994 ...
…132
Table
2-3- 2. Financial Support for Parents : 1994 ... 133
Table
2-3- 3. Attitudes toward Responsibility for Elderly Care : 1983 -1994 ... 134
Table
2-3- 4. Perception of Teenage Problems : 1984-1994 ... 135
Table
2-3- 5. Income Sources of Persons Aged 65 Years or
Over (Multiple Responses) by Sex and Age :
1998 ... 136
Table
2-3- 6. Current Subjective Health Status of Elderly Pensioners Aged 65
Years or Over by Sex
,
Age :
1998 ... 137
Table
2-3- 7. Distribution of Economic Dependents of Elderly Persons
Aged
65 Years or Over (Multiple Resources) by Region
,
Age
,
Sex :
1998 ... 138
Table
2-3- 8. Employment Status of Elderly Persons Aged 65 Years
or Over by Region and Education Level
1998 ...
…139
Table
2-3-9. Status of Will to W ork of Elderly Persons Aged 65 Years
or Over by Region and Education Level
1998 ...
…139
Table
2-3-10.
Kn
owledge of
,
Utilization Rate
,
Future Utilization Desires
,
and Satisfaction Level of Elderly Welfare Services of Elderly Persons
Aged
65 Years or over : 1998 ... 140
Table
2-3-1
1.View of Elderly Persons Aged
65 Years or Over Regarding
Persons Aged 65 Years or Over by Characteristic : 1998 ... 143
3. National Health
L
ife
&
Health
Index
Table 3-1-
1.Life Expectancy by Age : 1970-1995 ... 146
Table 3-1- 2. Infant Mortality Rate : 1970-1996 ... 148
Table 3-1- 3. Infant Mortality Rate by Fetal Sex and Age of Mother
: 1993 Birth Cohort
.“…….“….“.“…….“…….“…… .. …… .. …….“…….“…….“…….“…….“…… •• …… …….“…… •• .. …… .. …….“…….“…….“…….“…….“…….“…….“…….“…… .. …….“…….“…… …….“…….“…….“…….“…….“…….“…… .. .. …… .. …….“…… …… .. …… .. …… .. …… .. .. …… .. …….“…… …… .. …… .. .. …….“…… …… .. …… .. .. …… …… .. …… .. .. …… .. …… …… .. .. …… .. …… …… .. .. …… •• …… …… •• .. … ... …… …… .. .. …… .. …… .. …… .. …… .. …… …… .. …… .. .. …… …… .. .. …… …… .. … .. ... …… .. …… … •• … .. .. … •• …… .. …… …… .. …… .. …… .. .. …… .. …… .. …… .. …… .. …… .. …… …… .. …… .. …… .. .. … ..148
Table 3-1- 4. Infant Deaths by Age at Death : 1993 Birth Cohort ..
…….“…….“…… …….“…….“…….“…….“…….“…….“…….“…….“…….“…….“…….“…… •• .. …….“…… …….“…….“…….“…….“…… .. •• …….“…….“…….“…… …… .. …….“…….“…….“…….“…….“…….“…….“…… •• …… .. …… .. .. …… .. ….“.149
Table 3-1- 5. Major Causes of Neonatal
Morπta떠lity: 1993 Birth Cohort ..
…… …… .. .. …… .. …… …… .. .. …… .. …… .. …… .. …… .. …… .. …… .. …… .. …….“…… …… .. .. …… .. …… .. …… .. …… .. …… …… .. …… .. …… .. .. …… .. …… …… •• …… •• .. …… .. …… … .. ..149
Ta때b비le 3운-1-
6.
Ma따tema떠1Mortality Ratio
,
Matemal Mortality Rate and
Proportion
Ma따tema려1:
1995 and 1996
.“……….“……….“……….“……….“……….“……….“……….“……….“……….“……….“……….“……….“……… .. ……… ……… •• ……….“……….“……… .. .. ……… .. ……… ……… .. ……… .. .. ……… .. ……… .. ……… .. ……… .. ……… ……….“……….“……….“……… .. .. ……….“……… .. ……….“……….“……….“……… ……… .. ……… •• .. ……… .. ……….“……….“……….“……….“……….“……… ……… .. .. ……… .. ……… .. ……….“……….“……….“……….“……… .. ……….“……….“……….“……… ……… .. .. ……… .. ……… ……… •• ……… •• .. ……….“……… .. ……… …… .. .. ….“.150
0
Ta때b비le 3운-1- 7τ.
Lifetime
R많is양k 0아fMatemal Death
,
1995 and 1996 ..
……… …… .. .. … .. ……… ……… .. ……… .. .. ……… ……… .. ……… .. .. ……… .. ……… •• ……… ……… •• .. ……… .. ……… ……… .. ……… .. .. ……… ……… .. .. …… .. ……… .. ……… .. ……… ……… •• .. …… .. … .. …… …… .. ……… .. •• …… ……… .. .. ……… ……… .. ……… .. .. …… .. ……… ……… .. .. ……… .. ……… .. ……… .. ……… .. ……….“…….“….“.150
0Tä때b비le 3운-
1 - 8. Causes of
Ma따tema떠1Death : 1995 and 1996 ..
……… •• ……….“……….“……….“……….“……… ……….“……….“……….“……….“……….“…….“….“ ••• •• “……….“……….“……… •• ……… •• ……….“……….“…….“… •••• “……….“……… ……….“……… .. .. ……….“……… •• ……….“……….“……….“……….“……….“……….“……….Morbidity and Dealth
Table 3-2-
1.Morbidity Rate
,
Average Number of Days of Reduced Activity and
in Bed During the 2 Survey Weeks : 1989-1995 ... 152
Table 3-2- 2. Morbidity Rates of Adult Diseases : 1995 ... 153
Table 3-2- 3. Malignant Cases and Prevalence Rate by Organs and Sex
1992 ... 154
Table 3-2- 4. Malignant Cases and Prevalence Rate of Malignant Neoplasm
of the Stomach by Sex and Age : 1992 ... 156
Table 3-2- 5. Malignant Cases and Prevalence Rate of Malignant Neoplasm
of the Rectum-Anus by Sex and Age :
1992 ... 158
Table
3-2- 7. M
a1ignant Cases and Prevalence Rate of M
a1ignant Neoplasm
of the Liver and Intrahepatic Bile Ducts by Sex and Age :
1992 ... 159
Table
3-2- 8. M
a1ignant Cases and
Prev
a1ence Rate of Malignant Neoplasm
of the Trachea
,
Bronchus and Lung by Sex and Age :
1992 ...
…160
Table 3-2- 9. M
a1ignant Cases and Prevalence Rate of M
a1ignant Neoplasm
of the Hematopoietic and Re Systems by Sex and Age :
1992 ... 161
Table
3-2-10. Malignant Cases and Prev
a1ence Rate of M
a1ignant Neoplasm
of the Bone
,
Joints ànd Articular Cartilage by Sex and Age :
1992 ... 162
Table
3-2-1
1.Malignant Cases and Prevalence Rate of M
a1ignant Neoplasm
of the Skin by Sex and Age :
1992 ... 163
Table
3-2-12. M
a1ignant Cases and Prevalence Rate of M
a1ignant Neoplasm
of the Breast by Sex and Age :
1992 ...
…164
Table
3-2-13. M
a1ignant Cases and Prevalence Rate of M
a1ignant Neoplasm
of the Uterus and Cervix Uteri by Age :
1992 ... 165
Table
3-2-14. Mortality Rate by Major Causes of Death and Sex
by Cause of Death :
1988-1997 ...
…
166
Table
3-2-15. Traffic Accidents and Deaths : 1970-1995 ... 168
Table
3-2-16. Major 5 Causes of DeathCTotaD by Age
,
No. of Deaths
and Mort
a1ity Rate :
1997 ... 170
Table
3-2-17. Major 5 Causes of DeathCMale) by Age
,
No. of Deaths
and Mort
a1ity Rate :
1997 ... 171
Table
3-2-18. Major 5 Causes of DeathCFemale) by Age
,
No. of Deaths
and Mort
a1ity Rate :
1997 ... 172
Table
3-2-19. Estimated No. of Elderly with Dementia by City
/Province :
1995 ... 173
Table
3-2-20. Estimated Number of Elde
r1
y with Dementia by age
,
1995-
‘-2020 ..
Attitude About Health
Table
3-3-
1.Percentage of Smokers :
1989-1995 ... 174
Table
3-3- 2. Percentage of Drinkers : 1986-1995 ... 175
Table
3-3- 3. Frequency of Overdrinking : 1986 -1995 ... 176
Table 3-3- 5. Ways of Maintaining Health : 1986 -1995 ... 178
Health Management
Table 3-4-
1.Rate of Health Examination and Occupational Diseases
1970 -1997 ... 179
Table 3-4- 2. Immunization Rates for the Last Birth Experienced
C1
990- May 1994)
by Education and Region
,
and by the
Kind of Immunization ... 180
Nutrition
Table 3-5-
1.Nutrient Supply - per Capita per Day : 1975-1997 ... 181
Table 3-5- 2. Food Supply - per Capita per Day : 1975-1997 ... 182
Body
Table 3-6-
1.A verage Height of Students by Age : 1975 -1997 ... 183
Table 3-6- 2. Average Weight of Students by Age : 1975-1997 ...
…184
Table 3-6- 3. Body Mass Index of Students by Age : 1975-1997 ... 185
Table 3-6- 4. Average Chest Circumference of Students by Age : 1975-1997 ... 186
4. Health Resources
Medical Facilities
Table 4-1-
1.Number of Hospital
&
Clinic Faci1ities by Hospital
&
Clinic
Type of Hospital
&
Clinic Facility : 1980 -1997 ...
…190
Table 4-1- 3. Number of Hospital
& Clinic Facilities by Medical Facility
Type : 1997 ... 192
Table 4-1- 4. Number of Hospital
&
Clinic Facilities per 100
,
000 of the Population
by Medical Facility Type : 1997 ... 194
Table .4-1- 5. Number of Inpatient Care Beds by Type of Hospital
&
Clinic
Facility : 1980-1997 ... 196
Table 4-1- 6. Number of Beds per 100
,
000 of the Population
by Type of Hospital
&
Clinic Facility : 1980-1997 ... 198
Table 4-1- 7. Number of Beds by Hospital
&
Clinic Facility Type : 1997 ... 200
Table 4-1- 8. Number of Inpatient Care Beds per 100
,
000 of the Population
by Type of Hospital
&
Clinic Facility and : 1997 ... 202
Table 4-1- 9. Number of Health Centers
,
Subcenters and Primary Health Care Posts
: 1975-1997 ... 204
Table 4-1-10. Emergency Medical Service Facilities : 1995-1997 ... 205
Table 4-1-1
1.Establishment of
Blood Centers : 1985-1997 ... 206
Table 4-1-12. Number of Se
l1
ers of Drugs
,
Medical Instruments
,
etc. : 1980-1997 ... 207
Health Manpower
Table 4-2-
1.Number of
Licenced Physicians : 1975 -1997 ... 208
Table 4-2- 2. Number of
Licenced Dentists : 1975-1997 ... 208
Table 4-2- 3. Number of Licenced Oriental Medical Doctors : 1975-1997 ... 209
Table 4-2- 4. Number of Pharmacists
,
Midwives
,
Licenced Nurses
and Field Specified Nurses
,
Qualified Nursing Aides : 1975 -1997 ... 209
Table 4-2- 5. Number of Qualified Medical Specialists : 1975-1997 ... 210
Table 4-2- 6. Number of
Licenced Technicians : 1975-1997 ... 210
Table 4-2- 7. Results of National Medical Examination and Qualification
Examination for Specialists
1975-1997 ... 212
Table 4-2- 8. Results of the Qualification Examination for Specialists : 1975-1997 ... 214
Table 4-2- 9. Number of Hospital
&
Clinic Personnel : 1981-1997 ... 216
the Population : 1981 -1997 ... 217
Table 4-2-1
1.Number of Hospital & Clinic Personnel by Type of
Medical Facility : 1997 ... 218
Table 4-2-12. Number of Hospit
a1& Clinic Personnel per 100
,
000 of the Population
by Type of Hospital
&
Clinic Facility : 1997 ... 220
Table 4-2-13. Number of Personnel in Health Centers : 1985-1997 ... 222
Table 4-2-14. Number of Staff in Health Subcenters and Primary Health Care Posts
: 1985-1997 ... 224
Table 4-2-15. Number of Medical Personnel : 1984-1997 ... 225
Table 4-2-16. Persons per Medical Personnel : 1984-1997 ... 226
Medical
Table 4-3-
1.Daily Average No. of Inpatients and Average Length of Stay
: 1970-1996 ... 227
Table 4-3- 2. Activities of Hospit
a1s : 1997 ... 228
Table 4-3- 3. Bed Utilization Rate by Ownership
,
and by Ward : 1970 -1997 ... 230
Table 4-3- 4. No. of Visitors to Medical Doctors
&
Days of Medical Treatment
During the Previous 2 Weeks
1989-1995 ... 231
Table 4-3- 5. Number and Composition of Inpatients and Outpatients
by Type of Medical Facility : 1994 ... 232
Table 4-3- 6. Number of Outpatients per 100
,
000 of the Population
by Disease and Sex : 1992
,
1994 ... 233
Table 4-3- 7. Number of Outpatients per 100
,
000 of the Population
by Type of Medical Facility
,
and by City and Province : 1994 ... 234
Table 4-3- 8. Average Length of Stay for Discharge Patients : 1992
,
1994 ... 235
Table 4-3- 9. Average Length of Stay by Major Chronic Disease : 1990-1994 ... 236
Table 4-3-10. Levels of Satisfaction with Medical Service : 1995 ... : ... 238
Table 4-3-1
1.Reasons for Dissatisfaction with Medical Service
1995 ... 239
Li
velihood Protection
Table 5-1-
1. Public Assistance Recipients : 1990-1997 ... 243
Table 5-1- 2. Classification of Livelihood Protection Recipients
1991 -1997 ... 244
Table 5-1- 3. Institutional Protection of Livelihood Protection Recipients
: as of Jan.
,
1997 ... 246
Table 5-1- 4. Self-support Possibility of Livelihood Protection Recipients
1996 ... 247
Table 5-1- 5. Employment Status of Livelihood Protection Recipients
1996
… ...248
Table 5-1- 6. Required Time for Self-support of Livelihood Protection Recipients
: 1996 ... 249
Table 5-1- 7. Education Status of Livelihood Protection Recipients
1996 ... 249
Table 5-1 - 8. Recipients and Amount of Livelihood Protection Benefits
by Benefits Category and City
/P
rovince : 1985-1997 ... 251
Table 5-1- 9. Housing Status of Livelihood Protection Recipients1)
1991-1997 ... 252
Medical Aid
Table 5-2-
1.Medical Aid Recipients by Category
I(100% Coverage Cost)
: 1992-1997 ... 253
Table 5-2- 2. Medical
Aid Recipients by InstitutionC100% Coverage Cost)
: 1992-1997 ... 254
Table 5-2- 3. Medical Aid Recipients by Age and Sex : 1992 -1997
… ...255
Table 5-2- 4. Achievement of Medical Aid Program : 1980-1997
… ...256
Table 5-3-
1.Patriot and Veteran Recipients Household : 1990-1996 ... 259
Table 5-3- 2. Medical Aid of Patriot and Veteran Recipients
1962-1996 ...
…260
Table 5-3- 3. Compensation for Patriot and Veteran Recipients
1985-1996 ... 261
Table 5-3- 4. Status of Supply and Demand for Physical Aid of Patriot
and Veteran Recipients
1990 -1996 ... 262
Table 5-3- 5. School Expenses of Patriot and Veteran Recipients : 1982 -1996 ... 264
6. Social Insurance
Medical Insurance
Table 6-1-
1.Covered Persons of Medical Insurance by Type of Insurance
Scheme and City
!P
rovince : 1980-1997 ... 266
Table 6-1- 2. Covered Persons of Medical Insurance for Govemment Employees
,
Private School Teachers and Other Personnel by City
!P
rovince
: 1980-1997 ... 268
Table 6-1- 3. Medical Insurance Associations and Covered Persons
by City
!P
rovince : 1985-1997 ... 270
Table 6-1- 4. Financial Balance of Medical Insurance by
Ins디ranceScheme
: 1985-1997 ... 272
Table 6-1- 5. Financial Balance of Medical Insurance for Industrial Workers
: 1985-1997 ... 272
Table 6-1- 6. Financial Balance of Medical Insurance for Govemment and
Private School Teachers : 1985-1997 ... 273
Table 6-1- 7. Financial Balance of Medical Insurance for Self-employed Persons
: 1985-1997 ... 274
Table 6-1- 9.
Amount of Contributions and Benefits of Medical Insurance
by City
/Province : 1985-1997 ... 276
Table 6-1 -10. Total
Amount of
Be
nefits
in
Medical
Insurance by
Be
nefit
갑peand
In
surance Scheme : 1997 ... 277
Pension Insured
Table 6-2-
1.Number of Public Pension Insured Persons
1980-1996 ...
…278
Table 6-2- 2. Number of National Pension Insured Persons
1988-1997 ... 279
Table 6-2- 3. Number of National Pension Insured Persons by Employee Engaged in Special
Occupation and Employee Having Foreign Nationality
1988-1997 ... 279
Table 6-2- 4. Number of National Pension Insured Persons
by Age and Sex : 1990-1997 ... 280
Table 6-2- 5. Number of National Pension Insured Persons
by Industrial Division
1990-1997 ... 282
Table 6-2- 6. Number of National Pension Insured Persons
by Class of Standard Monthly Income : 1995-1997 ... 284
Table
6~2-7. Amount of National Pension Benefits by Type of Benefit : 1988-1997 ... 286
Table 6-2- 8. Amount Paid for Fund of National Pension : 1988-1997 ... 289
Table 6-2- 9. Fund Management of National Pension : 1988-1997 ... 290
Table 6-2-10. Number of
Insured in the Government Employee Pension : 1982 -1997 ... 291
Table 6-2-1
1.Amount of Government Employee Pension Benefits : 1993-1997 ... 292
Table 6-2-12. Amount of Government Employee Pension Benefits : 1988-1997 ... 294
Table 6-2-13. Fund Management of Government Employee Pension
1982-1997 ... 295
Table 6-2-14. Number of Insured Persons in the Private School Teachers Pension
: 1975-1997 ... 296
Table 6-2-15. Amount of Private School Teachers Pension Benefits : 1991 -1997 ... 298
Table 6-2-16. Amount of
Private School Teachers Pension Benefits : 1982-1997 ... 300
Table 6-2-17. Amount of Contribution of Private School Teachers Pension
: 1992-1997 ... 302
Table 6-2-18. Establishing the Private School Teachers Pension Fund : 1975-1997 ... 303
Table 6-3-
1.Number of Establishments and Workers Covered by lndustrial
Accident Compensation Insurance by lndustry : 1989-1996 ... 304
Table 6-3- 2. Number of W orkers Covered by lndustrial Accident lnsurance
: 1970-1996 ... 306
Table 6-3- 3. Payment of lndustrial Accident Compensation lnsurance
by
Ki
nd of Payment : 1975-1996 ... 307
Table 6-3- 4. lndustrial Accidents : 1975-1996 ... 308
Table 6-3- 5. Benefit Cases of lndustrial Accidents Compensation lnsurance
by
Ki
nd of Payment : 1975-1996 ... 312
Table 6-3- 6. Rates of Frequency
,
Severity and Death in lndustrial Accidents
: 1970-1997 ... 313
Employment lnsurance
Table 6-4-
1.Coverage Status of Employment lnsurance
1997 ... 314
Table 6-4- 2. Coverage Status of Employment lnsurance by Area : 1995 -1997 ... 315
Table 6-4- 3. Coverage Status of Employment lnsurance by lndustries
1995-1997 ... 316
Table 6-4- 4. Fund Management of Employment Insurance : 1997 ... 317
Table 6-4- 5. Number of Establishments with Employment Insurance
by Industry Type and Number of Employees : 1997 ... 318
Table 6-4- 6. Amount of Employment Insurance Benefits
1995-1998 ... 320
Social Welfare
Table 7-1-
1.Number of Welfare Institutes
,
Average No. of Persons
&
Workers
: 1980-1996 ... 323
Table 7-1- 2. Social Welfare Institutions and Inmates by Institution Type
: 1985-1997 ... 324
Table 7-1- 3. Social Welfare Service Centers : 1985-1997 ... 325
Table 7-1- 4. Qualified Social Workers : 1980-1997 ... 326
/ ‘