저작자표시-비영리-변경금지 2.0 대한민국 이용자는 아래의 조건을 따르는 경우에 한하여 자유롭게 l 이 저작물을 복제, 배포, 전송, 전시, 공연 및 방송할 수 있습니다. 다음과 같은 조건을 따라야 합니다: l 귀하는, 이 저작물의 재이용이나 배포의 경우, 이 저작물에 적용된 이용허락조건 을 명확하게 나타내어야 합니다. l 저작권자로부터 별도의 허가를 받으면 이러한 조건들은 적용되지 않습니다. 저작권법에 따른 이용자의 권리는 위의 내용에 의하여 영향을 받지 않습니다. 이것은 이용허락규약(Legal Code)을 이해하기 쉽게 요약한 것입니다. Disclaimer 저작자표시. 귀하는 원저작자를 표시하여야 합니다. 비영리. 귀하는 이 저작물을 영리 목적으로 이용할 수 없습니다. 변경금지. 귀하는 이 저작물을 개작, 변형 또는 가공할 수 없습니다.
Regulation of mitochondrial respiration by
LDHB suppression in hepatoma cell lines
by
Imkyong Park
Major in Molecular Medicine
Department of Biomedical Sciences
Regulation of mitochondrial respiration by
LDHB suppression in hepatoma cell lines
by
Imkyong Park
A Dissertation Submitted to The Graduate School of
Ajou University in Partial Fulfillment of the Requirements
for the Degree of Master of Biomedical Sciences
Supervised by
Gyesoon Yoon, Ph.D.
Major in Molecular Medicine
Department of Biomedical Sciences
The Graduate School, Ajou University
This certifies that the dissertation
of Imkyong Park is approved.
SUPERVISORY COMMITTEE
Gyesoon Yoon
Tae Jun Park
You-Sun Kim
The Graduate School, Ajou University
19th, June, 2015
i - ABSTRACT -
Regulation of mitochondrial respiration by
LDHB suppression in hepatoma cell lines
Increase in aerobic glycolysis and mitochondrial dysfunction are important metabolic features in human cancers. However, it still remains unclear how these phenomena are developed during tumorigenesis. To maintain aerobic glycolysis, continuous generation of NAD+ by lactate dehydrogenase (LDH) with conversion of pyruvate to lactate is essential.
Functional LDH is homo- or heterotetramers assembled from two types of subunit with LDHA and LDHB gene product. Recently, we reported that LDH5 isoenzyme formed by LDHB suppression is involved in increased glycolytic lactate production and mitochondrial respiratory defects in hepatoma cells. In this study, we aimed to investigate how LDHB suppression is linked with mitochondrial respiratory dysfunction. When LDHB expression was suppressed by siRNA-mediated knockdown, cellular oxygen consumption rate was significantly decreased without clear decrease in expressions of respiratory proteins. These results imply that LDHB suppression may control mitochondrial respiration through post translational modification or respiratory subunits or control of metabolites. Thus, we focused on pyruvate dehydrogenase (PDH) which is a key regulatory enzyme linking glycolysis and mitochondrial activity by controlling TCA cycle. Interestingly, LDHB knockdown effectively increased phosphorylation of PDH, indicating its inactivation. Treatment of lactate without
ii
LDHB knockdown increased PDH phosphorylation with lowering pH. This result implies that PDH phosphorylation is correlated with acidification, but is not lactate-specific event. Collectively, our results suggest that lactate-mediated PDH inactivation is the key mechanism to induce mitochondrial dysfunction in LDHB-suppressed hepatoma cell.
Keyword: Mitochondrial dysfunction, Aerobic glycolysis, LDHB (lactate dehydrogenase B), PDH (pyruvate dehydrogenase), Lactic acidosis, Hepatoma cell
iii
TABLE OF CONTENTS
ABSTRACT ………..i
TABLE OF CONTENTS ……….iii
LIST OF FIGURES ………..v
I. INTRODUCTION ……….1
II. MATERIAL AND METHODS ………5
A. Cell cultures and cell growth rate ………..5
B. Western blot analysis ………..5
C. Transfection of siRNAs ………..6
D. LDH isoenzyme in gel activity ………..7
E. Lactate level in cultured medium ………7
F. Real-time reverse transcription-polymerase chain reaction (RT-PCR) ………8
G. Mitochondrial membrane potential ………8
H. Endogenous cellular oxygen consumption rate ……….9
I. Chemicals ………....9
III. RESULTS ……….10
1. Decreased LDHB expression-mediated lactic acidosis is associated with mitochondrial respiratory activity. ………...10
2. LDHB suppression is an upstream event of decreased mitochondrial respiration. …..13 3. LDHB knockdown induces PDK-mediated PDH phosphorylation without HIF1-PDK1
iv
induction. ……….17
4. Lactic acidosis increases PDH phosphorylation. ……….…22
5. LDHB-suppression-induced PDH phosphorylation is mediated through ERK activation. ………...27
6. Lactic acidosis delays cell growth with morphological changes. ………30
IV. DISCUSSION ………..34
REFERENCES ………..36
국문요약 ………..41
v
LIST OF FIGURES
Fig. 1. Decreased LDHB expression is linked with lactic acidosis. ………11 Fig. 2. Decreased LDHB expression is associated with mitochondrial respiratory activity. ..12 Fig. 3. Mitochondrial respiratory inhibition does not affect LDHB expression. ………14 Fig. 4. Down-expressed LDHB induced to LDH isoenzyme shift. ………15 Fig. 5. LDHB suppression was associated with mitochondrial dysfunction. ……….16 Fig. 6. LDHB suppression induces PDH phosphorylation without induction of HIF and -PDK1 expression. ………..……19 Fig. 7. Expressions of PDK isotypes asr not induced by LDHB knockdown expression. .…20 Fig. 8. LDHB suppression-mediated PDH phosphoylation is regulated by PDK activation without induction of PDK expression. ………....…21 Fig. 9. Lactic acid induces PDH phosphorylation in a does dependent manner. ……….…….23 Fig. 10. Lactic acidosis, not lactate alone, increases PDH phosphrylation. …..………..24 Fig. 11. PDH phosphorylation is also slightly induced by acidification itself and further amplified by lactate-associated acidification. ……….25 Fig. 12. Lactic acidosis is associated with mitochondrial respiratory activity. ………...26 Fig. 13. LDHB-suppression-induced PDH phosphorylation is mediated through ERK activation. ………..….28 Fig. 14. Lactic acidosis-induced PDH phosphorylation is mediated through ERK activation. ………29
vi
Fig. 15. Lactic acidosis delays cell growth with morphological changes. ...31 Fig. 16. PDH suppression delays cell growth with morphological changes. ………..32 Fig. 17. Schematic model for regulation of mitochondrial respiration by LDHB suppression in hepatoma cell. ……….33
1
I. INTRODUCTION
Aerobically growing normal cells oxidize glucose into pyruvate through glycolysis with release of 2 ATP in cytosol, and then pyruvate is further oxidized into CO2 through
tricarboxylic acid (TCA) cycle and oxidative phosphorylation in mitochondria, thereby generating total 36 or 38 ATP depending on tissue type. However, when oxygen is limiting, cells cannot operate mitochondrial TCA cycle and oxidative phosphorylation, so produce ATP by activating glycolysis alone, termed anaerobic glycolysis. (Kim and Dang, 2006; Vander Heiden et al., 2009). Interestingly, many cancer cells depend on glycolytic ATP generation even in the presence of sufficient oxygen in culture or in tissue. This unexpected phenomenon was termed aerobic glycolysis. In fact, this phenomenon was first reported by Warburg in the 1920s, leading him to the hypothesis that cancer results from irreversibly impaired
mitochondrial metabolism (Warburg, 1956).
In the tumorigenesis, cancer cells rapidly increase their cell growth and proliferation, forming tumor nodular mass. Therefore, these cancer cells within certain size of the nodule must experience insufficient nutrient and oxygen due to limited blood vessel formation. This idea well supports the aerobic glycolysis of cancer cell. In addition, many studies also reported that mitochondrial respiration of cancer cell was damaged due to mitochondrial DNA mutation or altered mitochondrial biogenesis, even in aerobic condition (Taylor and Turnbull, 2005).As a result, cancer cells try to survive by maintaining cellular energy through activating glycolysis in the present of sufficient oxygen.
2
Although ATP generation rate per glucose of glycolysis is relatively low, its timely fast process may compensate total cellular energy need. However, to satisfy the cellular energy level through aerobic glycolysis, two additional conditions are required. First, is efficient and effective uptake of glucose in the condition of limited blood supply. For example, normal liver cell possesses Glut2, of which Km is 15 to 20 mM, so the cell uptakes glucose only high blood glucose condition. However, it is reported that hepatoma cell overexpressed Glut1, of which Km is 1 mM, thereby hepatoma cells can efficiently uptake glucose even in low glucose environment that is induced by nodular formation-induced hypoxia (Amann et al., 2009). Second condition is continuous re-supply of NAD+, oxidized form of NADH, to maintain the GAPDH (Glyceraldehyde 3-phosphate dehydrogenase)-mediated reaction step. This critical condition is fulfilled by the LDH (lactate dehydrogenase), the final fermenting step of glycolysis.
LDH is an enzyme that catalyzes the reversible conversion between pyruvate to lactate, using NADH or NAD+ as a co-substrate. LDH is composed of tetrameric subunits of two
different gene products, LDH-H (heart type) and LDH-M (muscle type). LDH-H is encoded by the LDHB gene and subunit LDH-M is by LDHA gene. In general, cells contain five different LDH isoenzymes as a result of the five different combinations of H and LDH-M: LDH1 (H4); LDH2 (MH3); LDH3 (M2H2); LDH4 (M3H); LDH5 (M4) (Drent et al., 1996). These isoenzymes show different substrate reactivity. LDH5 preferentially converts pyruvate into lactate and LDH1 has reverse reactivity, converting lactate into pyruvate (Kim et al., 2011).
3
known to be the key upstream regulators for both mitochondrial suppression and glycolytic activation through LDHA gene induction (Lewis et al., 2000). Therefore, LDHA gene induction and resultant LDH5 activity are known to play a key role to maintain glycolytic ATP generation in cancer cell. Recently, it has been reported that suppression of LDHB gene transcription effectively activates LHD5 formation and glycolytic activation in hepatoma cell. In addition, this phenomenon was associated with mitochondrial dysfunction (Kim et al., 2011). This observation remains a question of how LDHB suppression is linked with the mitochondrial respiratory defect.
PDC (pyruvate dehydrogenase complex) is the key enzyme of glucose metabolism which starts mitochondrial oxidation process, generating acetyl-CoA from pyruvate, the final of glycolysis.
Pyruvate + CoA + NAD+ → CO
2 + acetyl-CoA + NADH + H+ .
This reaction links glycolysis and the citric acid cycle in cell containing mitochondria (Harris et al., 2002). PDC is a large complex that is organized around a 60-meric dodecahedral core formed by PDH (pyruvate dehydrogenase, E1), acetyltransferase (E2) and E3-binding protein (E3BP), dihydrolipoamide dehydrogenase (E3), pyruvate dehydrogenase kinase (PDK), and pyruvate dehydrogenase phosphatase (PDP) (Read, 2001; Hiromasa et al., 2004; Hitosugi et al., 2011). PDH (pyruvate dehydrogenase) is the most important enzyme component of PDC
4
(Fan et al., 2014a). The enzymic activity of the PDC is regulated by the phosphorylation of three serine residues (sites 1, 2, and 3 are Ser-293, Ser-300, and Ser-232, respectively) located on the E1 component (Kolobova et al., 2001). Among these three sites, phosphorylation of Ser-293 was suggested to prevent active site accessibility of PDH to its substrate pyruvate (Seifert et al., 2007). The phosphorylation of these sites is catalyzed by PDK, a Ser/Thr kinase, whereas dephosphorylation of PDH is by PDP (Yeaman et al., 1978; Roche et al., 2001). Several studies reported that PDKs play key roles in the metabolic alteration of cancer cell. Expression of the PDK1 gene, as well as several glycolytic enzymes, is upregulated by c-Myc and HIF-1α (Kim et al., 2006; Pardo et al., 2006; Dang et al., 2008).
Collectively, these observations suggest that PDH may play a role to connect between mitochondrial respiratory regulation and LDHB suppression.
5
II. MATERIALS AND METHODS
A. Cell cultures and cell growth rate
Human hepatoma cells (SNU-387, SNU-354, and SNU-423) were purchased from Korean Cell Line Bank (Seoul, Korea) and were cultured in GIBCO® RPMI1640 medium (Invitrogen,
Carlsbad, CA) supplemented with 10% GIBCO® fetal bovine serum (FBS) (Invitrogen) and
GIBCO® antibiotics (Invitrogen) at 37°C in a humidified incubator with 5% CO
2. Chang cell
was obtained from American Tissue Culture Collections (ATCC, Rockville, MD) and Chang cell clone, denoted as Chang-L, which has higher hepatic characteristics (albumin production and liver-specific carbamoyl-phosphate synthase-1 expression) were isolated by single cell dilution and expansion, and used for this study (Kim et al., 2011). Chang-L clones were cultured in GIBCO® Dulbecco’s modified Eagle’s medium (DMEM) (Invitrogen)
supplemented with 10% GIBCO® FBS. Cell growth rates were monitored by counting the
trypan blue-negative viable cells.
B. Western blot analysis
Cultured cells were washed twice with PBS, and lysed with lysis buffer (1 M Tris-HCl [pH7.4], 150 mM NaCl, 0.1% SDS, 1% NP40) containing phosphatase inhibitor (200 mM NaF, 200 mM NaVO4) and protease inhibitor (200 mM PMSF, 500 mM leupeptin, 500 mM
pepstatin A) at 4℃ for 30min. The isolated proteins were separated on 8-12% SDS polyacrylamide gels and then transferred onto nitrocellulose membrane (Protran; Schleicher
6
and Schuell) using. These membranes were then incubated for 12 hours with the following primary antibodies. Next, the membranes were washed with 0.1% PBS-T buffer 3 times for 15 minutes each, after which, they were incubated with HRP-conjugated mouse, anti-rabbit, anti-sheep, and anti-goat antibody (1:3000-5000, Santa Cruz) for 1-2hours. The membranes were then washed 3 times with 0.1% PBS-T buffer for 15 minutes. Immunoreactive bands were visualized with the ECL system (West Save, Lab Frontier). Antibodies against phospho-PDH pSer293 (1:1000, AP1062) were purchased from Calbiochem
(San Diego, CA). Antibodies against PDH-E1α (1:2000, ab110330), PDK1 (1:2000, ab90444), LDHA (1:3000, ab9002) were purchased from Abcam Ltd (Cambridge, UK). Antibodies against phospho-p44/42 MAPK (Erk1/2) (1:1000, #9106), p44/42 MAPK (Erk1/2) (1:2000, #9102) were purchased from Cell signaling Technology, Inc (Danvers, MA). Antibodies against for NDUFA9 of complex I (A21344), flavoprotein (A11142) of complex II, UQCRC2 of complex III (A11143), and ATP5A1 of complex V (A21350) were from Molecular Probes Corp. (Eugene, OR) and labeled as Comp I, II, III, and V, respectively, in the figures.
C. Transfection of siRNAs
Small interfering RNAs (siRNA) into cells, cells were transfected with the siRNA duplexes using Oligofectamine™ Reagent (Invitrogen), respectively, according to the manufacturer’s instructions. Non-specific siRNA (siNC) were used as mock control. Target siRNAs were generated from Bioneer and single strand sequences of the siRNAs were as
5’-7
GCAGAUACCCUGUGGGACA-3’ for LDHB #2, 5’-CGUGCAUUCCCGAUUCCUU-3’
for LDHA #1, 5’-CUGGUUAGUGUGAAAU-3’ for LDHA #2,
GAGGAUGGGCUCAAAUACU-3’ for PDHA1 #1, CGUUACCACGGACACAGUA for PDHA1 #2.
D. LDH isozyme in-gel activity
Activity profiles of the five LDH isozymes are estimated by in gel activity analysis after separating the lysates (5 μg) on agarose native gel electrophoresis according to the protocol provided with an REP LDH Isoenzyme Assay Kit (Helena Laboratories, Beanmont, TX, USA) with Rapid Electrophoresis (Helena Lab.).
E. Lactate level in cultured medium
Lactate levels in cultured media were assessed using standard spectrophotometric assays (Robinson et al., 1985)with slight modification. Briefly, a portion (100 μl) of cultured medium was mixed with 200 μl of ice cold 1 M perchloric acid and incubated on ice. After centrifugation at 4000×g for 15 min, the supernatant was neutralized to pH 7.0 by adding the same volume of 0.7 M tripotassium phosphate solution. The neutralized supernatant (10 μl) was applied to spectophotometric lactate assay using ThermoMax microplate reader (Molecular Devices Co., Sunnyvale, CA, USA). Lactate level was estimated from standard lactate calibration curve prepared at the same condition and expressed as lactate (nmole) released from 1 μg of cell lysate.
8
F. Real-time reverse transcription-polymerase chain reaction (RT-PCR)
Total RNA was isolated using Trizol (Invitrogen) and cDNA was prepared using AMV reverse transcriptase (Promega). For real-time reverse transcription (RT)-PCR , it was performed with 40 cycles of the reaction involving 95°C for 15 seconds and 60°C for 60 seconds using THUNDERBIRDTM SYBRTM qPCR Mix (Toyobo Co., Ltd, Osaka, Japan) according to the manufacturer’s protocol. The PCR primer sets were produced by Bioneer as follows: PDK1,5’- CTATGAAAATGCTAGGCGTCTGT-3’ and 5’- AACCACTTGTATTGGCTGTCC-3’; PDK2,5’- AGGACACCTACGGCGATGA-3’ and 5’- TGCCGATGTGTTTGGGATGG-3’; PDK3,5’- GCCAAAGCGCCAGACAAAC-3’ and 5’- CAACTGTCGCTCTCATTGAGT-3’;
PDK4, 5’- TTATACATACTCCACTGCACCA-3’ and 5’-
ATAGACTCAGAAGACAAAGCCT-3’; ß-actin, 5'-CCTTCCTGGGCATGGAGTCCTGT-3’ and 5'-GGAGCAATGATCTTGATCTTC-3’. Expression levels of target mRNAs were normalized by ß-actin mRNA level.
G. Mitochondrial membrane potential
To estimate mitochondrial membrane potential, cells were treated with TTFA for the indicated periods, further incubated in media containing 10 mg/ml JC-1 (Molecular probe), and washed with PBS for 20 min at 37.8℃. The average cellular red and green fluorescence intensities were obtained by Axiovision 4.2 software with ratio module after visualization with 100 ms on Axiovert 200 M equipped with HBO103 using a LD Plan-Neofluar 40_ objective (Carl Zeiss AG, Gottingen, Germany). The ratio of red fluorescence to green one was
9 estimated and expressed as percentage of control.
H. Endogenous cellular oxygen consumption rate
Endogenous cellular oxygen consumption rate was measured in situ with cultured cells using XF-24 Extracellular Flux Analyzer (Seahorse Bioscience) according to the protocol provided. Briefly, cells were seeded on XF24c ell culture microplates (Seahorse Bioscience) at a density of 10,000 cells per well and preincubated with XF assay medium (Seahorse Bioscience) containing 1 mM pyruvate and 5 mM glucose. Its mitochondrial specificity was confirmed by adding 100 nM antimycin A.
I. Chemicals
Dichloroacetate (DCA) (347795), PD98059 (P-215), L-(+)-lactic acid solution (L1875), and Sodium lactate (L7022) were purchased from Sigma-Aldrich (St. Louis,MO).
10
III. RESULTS
1. Decreased LDHB expression-mediated lactic acidosis is associated with
mitochondrial respiratory activity.
First, the relationship between LDHB suppression and mitochondrial dysfunction of hepatoma cells was investigated by using three different SNU hepatoma cells, 387, SNU-354, and SNU-423, derived from human hepatocellular carcinomas. Chang-L (Ch-L) clone, which was derived from Chang cell and showed liver-characteristics and active mitochondrial respiration (Kim et al., 2011), was also used as a cell with active mitochondrial activity. SNU-354 and SNU-423 showed decreased LDHB expression, compared to Ch-L cell and SNU-387 cell (Fig. 1A). These two hepatoma cells with low LDHB expression showed a clear isoenzyme shift toward LDH5 (Fig. 1B), increased lactate level and decreased pH in medium (Fig. 1C). Interestingly, these two cells also showed decreased cellular oxygen consumption rates (Fig. 2). These data suggested that LDHB expression is associated with mitochondrial respiratory function.
11
Fig. 1. Decreased LDHB expression is linked with lactic acidosis.
Chang cell clone (Ch-L) and three different SNU hepatoma cell lines (SNU-387, SNU-354, and SNU-423) were cultured for 2 days to maintain exponentially growing state. A) Western blot analysis for LDHA and LDHB expression. B) In-gel activity profile of LDH isozymes was performed as described in the ‘Materials and methods’. C) Lactate levels in media. Media lactate levels released from the cells for 2 days were estimated and expressed as lactate (nmole) released from 1 μg of cell lysate protein. pH of media were immediately measured by using spectrophotometric analysis [**, < 0.01 vs.Ch-L (control)].
12
Fig. 2. Decreased LDHB expression is associated with mitochondrial respiratory activity. Endogenous cellular oxygen consumption rate was measured and its specificity for mitochondrial respiration was confirmed by adding 100 nM antimycin A. [**, <0.01 vs. Ch-L (control)].
13
2. LDHB suppression is an upstream event of decreased mitochondrial
respiration.
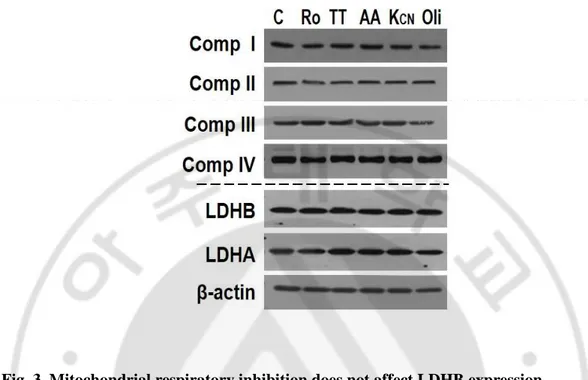
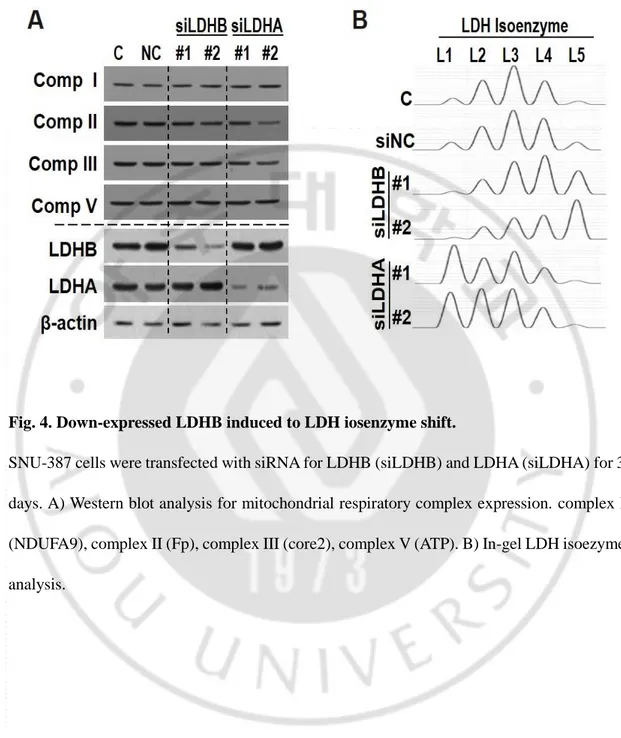
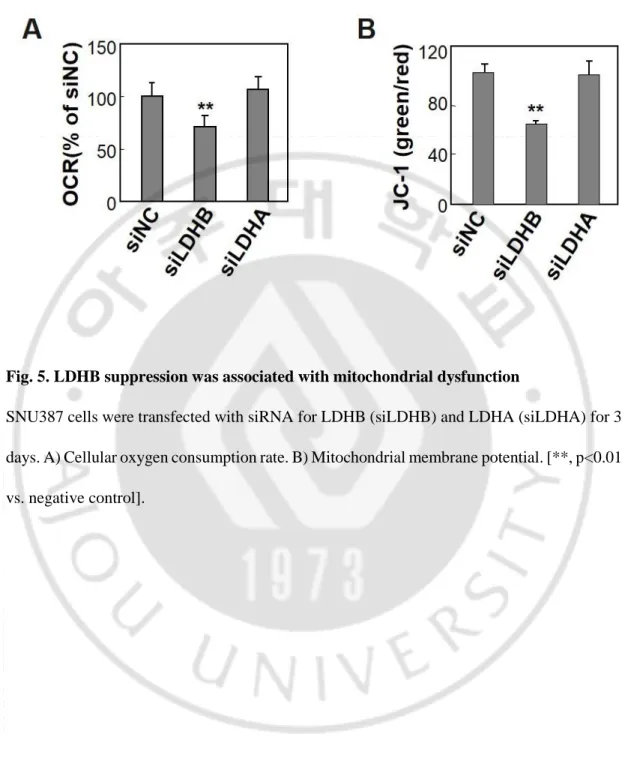
To further investigate the relationship between LDHB suppression and mitochondrial dysfunction, Ch-L (with active mitochondria) was treated with subcytotoxic doses of respiratory inhibitors, rotenone (complex I inhibitor), TTFA (complex II inhibitor), antimycin A (complex III inhibitor), KCN (complex IV inhibitor), and oligomycin (complex V inhibitor) for 12 hours as previously reported (Byun et al., 2008). LDHB expression was not altered by these respiratory inhibitions (Fig. 3). When LDHB expression was knocked down using siRNA in SNU-387 cells (high LHDB level), LDH isozyme was effectively shifted toward LDH5, but expressions of respiratory complex subunits were unchanged (Fig. 4). Nevertheless, cellular oxygen consumption rate and mitochondrial membrane potential were significantly decreased (Fig. 5). These results indicated that LDHB suppression-mediated LDH5 activation is the upstream event to decrease mitochondrial respiration without altering their subunit expressions.
14
Fig. 3. Mitochondrial respiratory inhibition does not affect LDHB expression.
Ch-L was treated with 10 μM Rotenone (Ro), 400 μM TTFA (TT), 10 μM antimycin A (AA), 10 mM KCN (Kcn), 10 μM Oligomycin (Oli) for 12 hours. Western blot analysis for mitochondrial respiratory complex subunits, complex I (NDUFA9), complex II (Fp), complex III (core2), complex IV (subunit II), LDHB, and LDHA expression.
15
Fig. 4. Down-expressed LDHB induced to LDH iosenzyme shift.
SNU-387 cells were transfected with siRNA for LDHB (siLDHB) and LDHA (siLDHA) for 3 days. A) Western blot analysis for mitochondrial respiratory complex expression. complex I (NDUFA9), complex II (Fp), complex III (core2), complex V (ATP). B) In-gel LDH isoezyme analysis.
16
Fig. 5. LDHB suppression was associated with mitochondrial dysfunction
SNU387 cells were transfected with siRNA for LDHB (siLDHB) and LDHA (siLDHA) for 3 days. A) Cellular oxygen consumption rate. B) Mitochondrial membrane potential. [**, p<0.01 vs. negative control].
17
3. LDHB knockdown induces PDK-mediated PDH phosphorylation without
HIF1/PDK1 induction.
To understand the molecular mechanism of how LDHB suppression induces mitochondrial dysfunction, two hypotheses were proposed. One possibility is that LDHB suppression may decrease expressions of mitochondrial respiratory complex subunits. However, as shown in fig.4A, LDHB knock-down did not altered expression of respiratory subunits. The other possibility was placed on post-translational modification of mitochondrial respiration-linked enzymes. PDH was first targeted due to its important role as tumor-associated metabolic shift. PDH is the key enzyme to turn on mitochondrial TCA cycle and resultant respiration by producing acetyl-CoA.
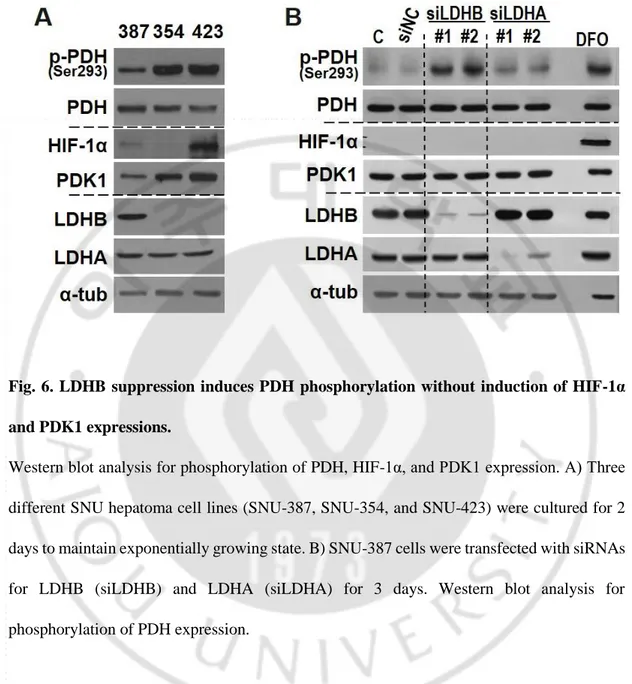
Interestingly, mitochondrial defective hepatoma cells, SNU354 and SNU423, showed increased PDH phosphorylation, which indicates PDH inactivation. It is well known that PDH is negatively regulated by PDK. There are four PDK isoforms that are distributed differently in tissues. Several studies reported that PDK1 play a key role in the metabolic alteration of cancer cell. Especially, PDK1 was known to be induced by HIF-1α and Myc. However, when LDHB expression was suppressed both HIF-1α and PDK1 expression remained unchanged (Fig. 6B). In 2011, Hitosugi T. et al reported that PDK1 activity was also regulated by post-translational modification, especially phosphorylation (Hitosugi et al., 2011). To check the involvement of PDK1 activity, Dichloroacetate (DCA), an inhibitor, was treated in LDHB down-expressed SNU-387 cell. Phosphorylation level by LDHB repression was clearly
18
reversed by DCA. These results imply that LDHB suppression-mediated PDH inactivation is mediated by activated PDK activity without induction of PDK expression.
19
Fig. 6. LDHB suppression induces PDH phosphorylation without induction of HIF-1α and PDK1 expressions.
Western blot analysis for phosphorylation of PDH, HIF-1α, and PDK1 expression. A) Three different SNU hepatoma cell lines (SNU-387, SNU-354, and SNU-423) were cultured for 2 days to maintain exponentially growing state. B) SNU-387 cells were transfected with siRNAs for LDHB (siLDHB) and LDHA (siLDHA) for 3 days. Western blot analysis for phosphorylation of PDH expression.
20
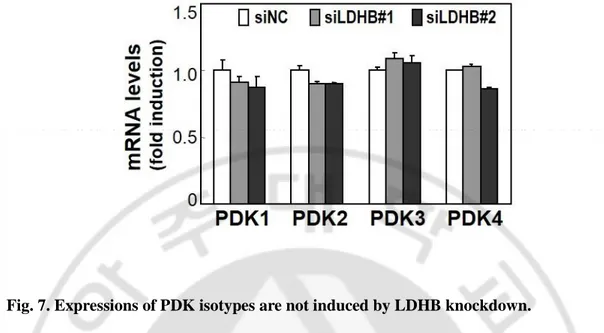
Fig. 7. Expressions of PDK isotypes are not induced by LDHB knockdown.
SNU-387 cells were transfected with siRNAs for LDHB (siLDHB) for 3 days. Quantitative analyses of the expression levels are shown.
21
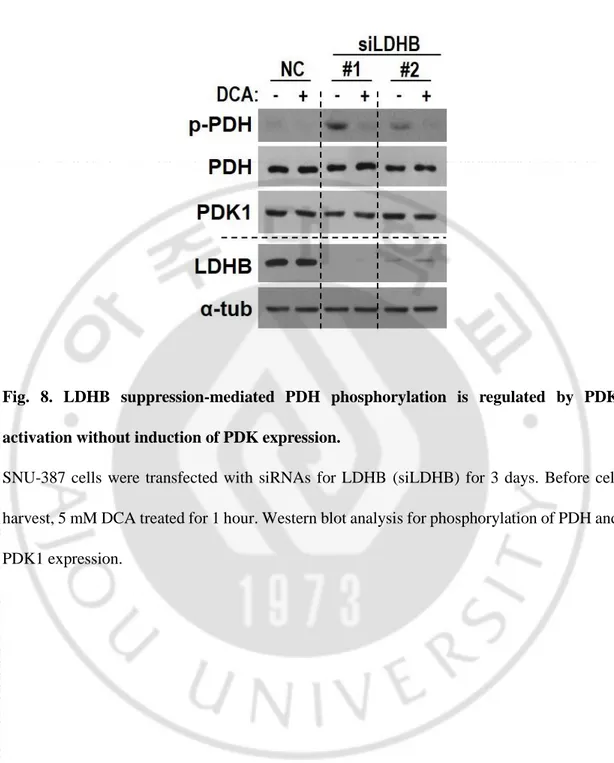
Fig. 8. LDHB suppression-mediated PDH phosphorylation is regulated by PDK activation without induction of PDK expression.
SNU-387 cells were transfected with siRNAs for LDHB (siLDHB) for 3 days. Before cell harvest, 5 mM DCA treated for 1 hour. Western blot analysis for phosphorylation of PDH and PDK1 expression.
22
4. Lactic acidosis increases PDH phosphorylation.
Next, I investigated the mechanism of how LDHB suppression induces PDK activation. LDHB suppression-mediated LDH5 induction must be linked with the hepatoma-associated lactic acidosis (Fig. 1C). Therefore, we tested whether PDH inactivation is mediated by lactic acidosis. Previous studies reported that the physiological concentration of lactate in the hypoxic tumor microenvironment reached about 5 to 20 mM (Rudrabhatla et al., 2006; Rattigan et al., 2012). When SNU-387 cells were treated with lactic acid for 12 hours, PDH phosphorylation increased in a dose-dependent manner (fig. 9) without induction of PDK transcription (fig. 11). This PDH phosphorylation started to increase 1hour after treatment (fig. 10A). Similar results were observed when SNU-387 cells were treated with the media containing 20 mM lactic acid and adjusted pH to 6.5, but not with the media containing 20 mM lactic acid with pH 7.8 (fig. 10B and 10C) , indicating that lactic acidosis, not the organic matter of lactate alone, is involved in PDH inactivation. Sodium lactate (20 mM) did not increase PDH phosphorylation, but decreasing pH alone slightly increased the phosphorylation (fig. 11A and 11B). Finally, it was clearly confirmed that PDH phosphorylation by 20 mM lactic acid was the most effective (fig. 11C). These results indicated that LDHB suppression-associated PDH phosphorylation is mediated by lactic acidosis.
23
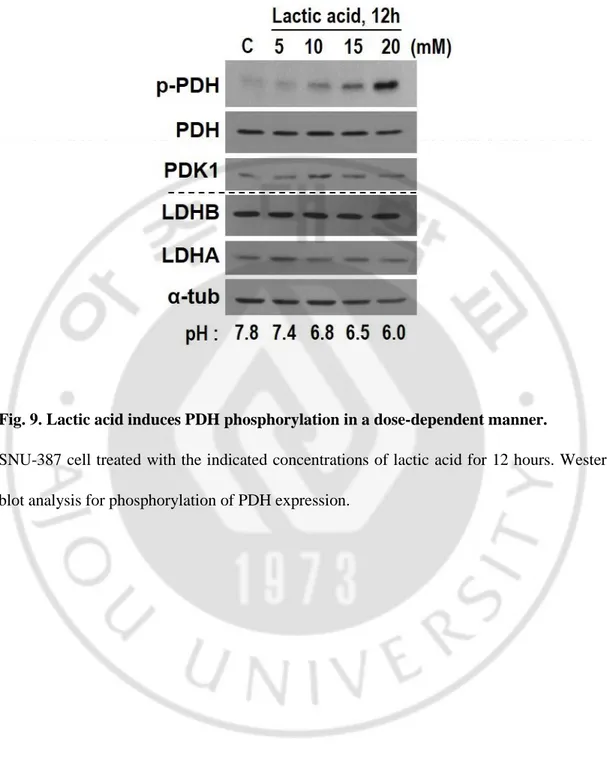
Fig. 9. Lactic acid induces PDH phosphorylation in a dose-dependent manner.
SNU-387 cell treated with the indicated concentrations of lactic acid for 12 hours. Western blot analysis for phosphorylation of PDH expression.
24
Fig. 10. Lactic acidosis, not lactate alone, increases PDH phosphorylation.
SNU-387 cell treated with 20 mM lactic acid in time-dependent manner. A) SNU-387 cell was treated only 20 mM lactic acid. B) SNU-387 cell was treated with 20 mM lactic acid and pH adjusted to 6.5 by 100 mM NaOH. C) SNU-387 cell was treated with 20mM lactic acid and pH adjusted to 7.8 by 100 mM NaOH.
25
Fig. 11. PDH phosphorylation is also slightly induced by acidification itself and further amplified by lactate-associated acidification.
A) SNU-387 cell was treated with sodium lactate for 12 hours. B) SNU-387 cell was treated with 5 N HCl for 12 hours. C) SNU-387 cell was treated with 20 mM lactic acid, 5 N HCl and 20 mM sodium lactate for 12 hours.
26
Fig. 12. Lactic acidosis is associated with mitochondrial respiratory activity.
Endogenous cellular oxygen consumption rate was measured and its specificity for mitochondrial respiration was confirmed by adding 100 nM antimycin A. [**, <0.01 vs. control].
27
5. Lactate induced PDH phosphorylation through ERK activation.
Next, I investigated the mechanism of how increased lactate by LDHB suppression-mediated PDH phosphorylation. In 2011, Grassian AR. et al. reported that ERK regulated PDH flux through PDK4 modulates cell proliferation (Grassian et al., 2011). To check the involvement of ERK activation, PD98059, a MAP kinase inhibitor, was treated in LDHB down-expressed SNU-387 cell. Phosphorylation level by LDHB repression was clearly reversed by PD98059 (fig. 13). These results imply that LDHB suppression-mediated PDH inactivation is mediated by ERK activation.
Next, I investigated the mechanism of how lactic acidosis induces PDH phosphorylation. When SNU-387 cell was treated with lactic acid, increased PDH and ERK phosphorylation (fig.14). These results imply that lactic acidosis-induced PDH phosphorylation is mediated through ERK activation.
28
Fig. 13. LDHB-suppression-induced PDH phosphorylation is mediated through ERK activation.
A) Western blot analysis for phosphorylation of PDH, ERK expression. SNU-387 cells were transfected with siRNAs for LDHB (siLDHB) for 3 days. B) Before cell harvest, 20 μM PD98059 treated for 1 and 4 hours.
29
Fig. 14. Lactic acidosis-induced PDH phosphorylation is mediated through ERK activation.
SNU-387 cell was treated with lactic acid (LA). Western blot analysis for phosphorylation of PDH and ERK expression. A) 15 and 20 mM in dose-dependent manner for 12 hours. B) 3, 6, and 12 hours in time-dependent manner for 20 mM.
30
6. Lactic acidosis effect on cell growth by PDH phosphorylation.
Finally, I investigated the phenotype of cell by lactate. When SNU-387 cells were treated with lactic acid for 12 hours, decreased the cell growth and change epithelial to fibroblastic morphology. These results indicated that similar to a low oxygen consumption rate and growth rate of SNU-354, SNU-423 cells (fig. 15). When PDH (PDHE1α) expression was knocked down using siRNA in SNU-387 cells, decreased the cell growth and change morphology. These results indicated that inactivation of PDH by lactic acid effect on cell growth (fig. 16).
31
Fig. 15. Lactic acidosis delays cell growth with morphological changes.
A) SNU-387 cell treated with 15 and 20 mM lactic acid (LA) for 12, 24, and 48 hours. Cell growth rates were monitored by counting the trypan blue-negative viable cells (a). Live and death cell number (b). B) SNU-387 cell treated with 20 mM lactic acid for 12 hours. Cellular morphology of SNU-387 cell. C) Cellular morphology of Ch-L and three different SNU hepatoma cell lines (SNU-387, SNU-354, SNU-423).
32
Fig. 16. PDH suppression delays cell growth with morphological changes.
SNU-387 cells were transfected with siRNAs for PDHA1 (siPDHA1) for 3 days. A) Western blot analysis for phosphorylation of PDH expression. B) Cell growth rates were monitored by counting the trypan blue-negative viable cells (a). Live and death cell number (b). C) SNU-387 cell treated with 20 mM lactic acid for 12 hours. Cellular morphology of SNU-SNU-387 cell.
33
Fig. 17. Schematic model for regulation of mitochondrial respiration by LDHB suppression in hepatoma cell.
These results suggest that activity of lactate increased by LDHB suppression. Accordingly, increased lactate was induced PDH inactivation. Also, increased lactate mediated PDH inactivation is mediated by ERK activation
34
IV. DISCUSSION
In this study, it was proved that LDHB suppression-mediated lactic acidosis induces mitochondrial respiratory dysfunction by inactivation of PDH in hepatoma cell lines. Thus, it was identified that several key functions: First, suppressed LDHB expression in hepatoma cell increased LDH5 activity and production and release. Accordingly, the increased extracellular lactate may be re-introduced back into the tumor cell and affect diverse cellular function. Second, LDHB suppression is an upstream event of decreased mitochondrial respiration. Third, I clearly demonstrated that lactic acidosis formed by released lactate induced the mitochondrial respiratory dysfunction by inactivation of PDH. Finally, LDHB-suppression-induced PDH phosphorylation is mainly mediated by ERK activation.
Extracellular release of lactate and resultant microenvironmental acidification, even under aerobic conditions (i.e., aerobic glycolysis), is a common feature of cancer development. Increased lactate levels often allows to predict for metastases and overall survival of patients, as shown by several studies (Holroyde et al., 1979; Walenta et al., 2000; Saraswathy et al., 2009). Lactate promotes tumor metastasis by inducing hyaluronan secretion from tumor-associated fibroblasts which generate a milieu favorable for migration (Rudrabhatla et al., 2006). Lactate itself also induces the tumor cell migration (Beckert et al., 2006; Baumann et al., 2009; Goetze et al., 2011). Lactate functions to stimulate production of VEGF, as well as a growth-promoting factors that assist in angiogenesis (Trabold et al., 2003). However, it remains unclear how lactate regulates mitochondrial respiratory function.
35
PDC is the key enzyme of glucose metabolism which starts mitochondrial oxidation process, generating acetyl-CoA from pyruvate, the final of glycolysis. The regulation of PDH activity through phosphorylation is well known in particular in cancer cell. Several studied have shown that new mechanisms regulate in the activity of PDH. For example, it is known that activity of PDH regulated TPKL/GSK3β (Hoshi et al., 1996). Also, phosphorylation of tyrosine residue through PDK1 and PDP1 inhibits PDH in EGF-stimulated cells (Fan et al., 2014a; Fan et al., 2014b).
Several studies reported that PDKs play key roles in the metabolic alteration of cancer cell. Expression of the PDK1 gene is upregulated by c-Myc and HIF-1α (Kim et al., 2006; Pardo et al., 2006; Dang et al., 2008). Interestingly, it was also proved that LDHB suppression-mediated lactic acidosis phosphorylated PDH through PDK activation by ERK without inducing PDK expression.
ERK pathway are critical in the regulation of several biological processes such as proliferation. In 2011, Grassian AR. et al. reported that ERK regulated PDH flux through PDK4 modulates cell proliferation (Grassian et al., 2011).
Our present study emphasize that aerobic glycolysis is not only achieved as an adaptive cellular strategy to meet energy deficit induced by tumoral hypoxia or mitochondrial respiratory defect, but also an active tumoral strategy to shut down mitochondrial respiratory function and induce aggressive tumoral properties.
36
REFERENCES
1. Amann T, Maegdefrau U, Hartmann A, Agaimy A, Marienhagen J, Weiss TS, Stoeltzing O, Warnecke C, Scholmerich J, Oefner PJ, Kreutz M, Bosserhoff AK, Hellerbrand C: GLUT1 expression is increased in hepatocellular carcinoma and promotes tumorigenesis. Am J Pathol 174: 1544-1552, 2009
2. Baumann F, Leukel P, Doerfelt A, Beier CP, Dettmer K, Oefner PJ, Kastenberger M, Kreutz M, Nickl-Jockschat T, Bogdahn U, Bosserhoff AK, Hau P: Lactate promotes glioma migration by TGF-beta2-dependent regulation of matrix metalloproteinase-2.
Neuro Oncol 11: 368-380, 2009
3. Beckert S, Farrahi F, Aslam RS, Scheuenstuhl H, Konigsrainer A, Hussain MZ, Hunt TK: Lactate stimulates endothelial cell migration. Wound Repair Regen 14: 321-324, 2006
4. Dang CV, Kim JW, Gao P, Yustein J: The interplay between MYC and HIF in cancer.
Nat Rev Cancer 8: 51-56, 2008
5. Drent M, Cobben NA, Henderson RF, Wouters EF, van Dieijen-Visser M: Usefulness of lactate dehydrogenase and its isoenzymes as indicators of lung damage or inflammation. Eur Respir J 9: 1736-1742, 1996
6. Fan J, Kang HB, Shan C, Elf S, Lin R, Xie J, Gu TL, Aguiar M, Lonning S, Chung TW, Arellano M, Khoury HJ, Shin DM, Khuri FR, Boggon TJ, Kang S, Chen J: Tyr-301 phosphorylation inhibits pyruvate dehydrogenase by blocking substrate binding
37
and promotes the Warburg effect. J Biol Chem 289: 26533-26541, 2014a
7. Fan J, Shan C, Kang HB, Elf S, Xie J, Tucker M, Gu TL, Aguiar M, Lonning S, Chen H, Mohammadi M, Britton LM, Garcia BA, Aleckovic M, Kang Y, Kaluz S, Devi N, Van Meir EG, Hitosugi T, Seo JH, Lonial S, Gaddh M, Arellano M, Khoury HJ, Khuri FR, Boggon TJ, Kang S, Chen J: Tyr phosphorylation of PDP1 toggles recruitment between ACAT1 and SIRT3 to regulate the pyruvate dehydrogenase complex. Mol
Cell 53: 534-548, 2014b
8. Goetze K, Walenta S, Ksiazkiewicz M, Kunz-Schughart LA, Mueller-Klieser W: Lactate enhances motility of tumor cells and inhibits monocyte migration and cytokine release. Int J Oncol 39: 453-463, 2011
9. Grassian AR, Metallo CM, Coloff JL, Stephanopoulos G, Brugge JS: Erk regulation of pyruvate dehydrogenase flux through PDK4 modulates cell proliferation. Genes
Dev 25: 1716-1733, 2011
10. Harris RA, Bowker-Kinley MM, Huang B, Wu P: Regulation of the activity of the pyruvate dehydrogenase complex. Adv Enzyme Regul 42: 249-259, 2002
11. Hiromasa Y, Fujisawa T, Aso Y, Roche TE: Organization of the cores of the mammalian pyruvate dehydrogenase complex formed by E2 and E2 plus the E3-binding protein and their capacities to bind the E1 and E3 components. J Biol Chem 279: 6921-6933, 2004
12. Hitosugi T, Fan J, Chung TW, Lythgoe K, Wang X, Xie J, Ge Q, Gu TL, Polakiewicz RD, Roesel JL, Chen GZ, Boggon TJ, Lonial S, Fu H, Khuri FR, Kang S, Chen J:
38
Tyrosine phosphorylation of mitochondrial pyruvate dehydrogenase kinase 1 is important for cancer metabolism. Mol Cell 44: 864-877, 2011
13. Holroyde CP, Axelrod RS, Skutches CL, Haff AC, Paul P, Reichard GA: Lactate metabolism in patients with metastatic colorectal cancer. Cancer Res 39: 4900-4904, 1979
14. Hoshi M, Takashima A, Noguchi K, Murayama M, Sato M, Kondo S, Saitoh Y, Ishiguro K, Hoshino T, Imahori K: Regulation of mitochondrial pyruvate dehydrogenase activity by tau protein kinase I/glycogen synthase kinase 3beta in brain.
Proc Natl Acad Sci U S A 93: 2719-2723, 1996
15. Kim JH, Kim EL, Lee YK, Park CB, Kim BW, Wang HJ, Yoon CH, Lee SJ, Yoon G: Decreased lactate dehydrogenase B expression enhances claudin 1-mediated hepatoma cell invasiveness via mitochondrial defects. Exp Cell Res 317: 1108-1118, 2011
16. Kim JW, Dang CV: Cancer's molecular sweet tooth and the Warburg effect. Cancer
Res 66: 8927-8930, 2006
17. Kim JW, Tchernyshyov I, Semenza GL, Dang CV: HIF-1-mediated expression of pyruvate dehydrogenase kinase: a metabolic switch required for cellular adaptation to hypoxia. Cell Metab 3: 177-185, 2006
18. Kolobova E, Tuganova A, Boulatnikov I, Popov KM: Regulation of pyruvate dehydrogenase activity through phosphorylation at multiple sites. Biochem J 358: 69-77, 2001
39
19. Lewis BC, Prescott JE, Campbell SE, Shim H, Orlowski RZ, Dang CV: Tumor induction by the c-Myc target genes rcl and lactate dehydrogenase A. Cancer Res 60: 6178-6183, 2000
20. Pardo JV, Pardo PJ, Humes SW, M IP: Neurocognitive dysfunction in antidepressant-free, non-elderly patients with unipolar depression: alerting and covert orienting of visuospatial attention. J Affect Disord 92: 71-78, 2006
21. Rattigan YI, Patel BB, Ackerstaff E, Sukenick G, Koutcher JA, Glod JW, Banerjee D: Lactate is a mediator of metabolic cooperation between stromal carcinoma associated fibroblasts and glycolytic tumor cells in the tumor microenvironment. Exp Cell Res 318: 326-335, 2012
22. Read RJ: Pushing the boundaries of molecular replacement with maximum likelihood.
Acta Crystallogr D Biol Crystallogr 57: 1373-1382, 2001
23. Robinson BH, McKay N, Goodyer P, Lancaster G: Defective intramitochondrial NADH oxidation in skin fibroblasts from an infant with fatal neonatal lacticacidemia.
Am J Hum Genet 37: 938-946, 1985
24. Roche TE, Baker JC, Yan X, Hiromasa Y, Gong X, Peng T, Dong J, Turkan A, Kasten SA: Distinct regulatory properties of pyruvate dehydrogenase kinase and phosphatase isoforms. Prog Nucleic Acid Res Mol Biol 70: 33-75, 2001
25. Rudrabhatla SR, Mahaffey CL, Mummert ME: Tumor microenvironment modulates hyaluronan expression: the lactate effect. J Invest Dermatol 126: 1378-1387, 2006 26. Saraswathy S, Crawford FW, Lamborn KR, Pirzkall A, Chang S, Cha S, Nelson SJ:
40
Evaluation of MR markers that predict survival in patients with newly diagnosed GBM prior to adjuvant therapy. J Neurooncol 91: 69-81, 2009
27. Seifert F, Ciszak E, Korotchkina L, Golbik R, Spinka M, Dominiak P, Sidhu S, Brauer J, Patel MS, Tittmann K: Phosphorylation of serine 264 impedes active site accessibility in the E1 component of the human pyruvate dehydrogenase multienzyme complex. Biochemistry 46: 6277-6287, 2007
28. Taylor RW, Turnbull DM: Mitochondrial DNA mutations in human disease. Nat Rev
Genet 6: 389-402, 2005
29. Trabold O, Wagner S, Wicke C, Scheuenstuhl H, Hussain MZ, Rosen N, Seremetiev A, Becker HD, Hunt TK: Lactate and oxygen constitute a fundamental regulatory mechanism in wound healing. Wound Repair Regen 11: 504-509, 2003
30. Vander Heiden MG, Cantley LC, Thompson CB: Understanding the Warburg effect: the metabolic requirements of cell proliferation. Science 324: 1029-1033, 2009 31. Walenta S, Wetterling M, Lehrke M, Schwickert G, Sundfor K, Rofstad EK,
Mueller-Klieser W: High lactate levels predict likelihood of metastases, tumor recurrence, and restricted patient survival in human cervical cancers. Cancer Res 60: 916-921, 2000 32. Warburg O: On respiratory impairment in cancer cells. Science 124: 269-270, 1956 33. Yeaman SJ, Hutcheson ET, Roche TE, Pettit FH, Brown JR, Reed LJ, Watson DC,
Dixon GH: Sites of phosphorylation on pyruvate dehydrogenase from bovine kidney and heart. Biochemistry 17: 2364-2370, 1978
41 -국문요약- 간암세포주에서 나타나는 LDHB 발현저하에 의한 미토콘드리아의 호흡 활성 조절 기전 연구 아주대학교 대학원 의생명과학과 박 임 경 (지도교수: 윤 계 순) 미토콘드리아는 세포 내 호흡을 조절하며 세포가 필요로 하는 에너지 생성에 중요한 역할을 하는 세포소기관이다. 산소가 충분히 존재하는 정상적인 환경에서 세포는 미토콘드리아의 산화적 인산화 과정을 통해 많은 에너지를 생성하지만, 산소가 부족하거나 존재하지 않는 환경의 경우 해당과정만을 이용하여 에너지를 생성한다. 반면 많은 암세포의 경우, 산소의 존재유무와 관계없이 해당과정으로만 에너지를 얻는 것으로 알려져 있다. 이러한 해당과정의 활성화는 암세포에서 중요한 대사적 특징이다. 그러나 이러한 현상이 암화과정 (Tumorigenesis)에 어떠한 영향을 미치는지는 명확히 밝혀진 바가 없다. 해당과정을 지속적으로 유지하기 위해서 암세포는 Lactate dehydrogenase (LDH)라는 효소를 이용하여 Pyruvate 를 Lactate 로 환원시키면서 산화된 형태의 NAD+를 지속적으로 공급시킨다. 따라서 LDH 의 활성조절이 암세포의 해당과정 유지에 중요한 역할을 하고 있음을 알 수 있다. 이전 보고에서
42 간암세포에서 나타나는 LDHB (4 단위로 구성된 LDH 의 하나의 단위단백질)의 발현저하가 미토콘드리아 호흡 손상과 연관되어 있는 것이 보고되었다. 따라서 본 연구에서는 LDHB 발현저하가 미토콘드리아의 호흡 손상과 어떻게 연관되어 있는지 알아 보고자 하였다. LDHB의 발현을 감소시켰을 때 미토콘드리아 respiratory protein들의 발현 감소는 없었지만, 세포의 산소 소비율과 미토콘드리아 막전위 (mitochondrial membrane potential)가 감소하는 것을 확인하였다. 이 결과로 LDHB 발현저하가 미토콘드리아 기능 손상의 상위에 존재하는 것을 알 수 있었고, 이러한 현상이 호흡관련 유전자의 발현 조절에 의한 것은 아니라는 것을 알 수 있었다. 흥미롭게도 LDHB발현 저하로 TCA cycle의 첫 반응을 개시하는 효소인 Pyruvate dehydrogenase (PDH)의 인산화가 증가되는 것을 확인하였다. 또한, LDHB의 발현저하 없이 lactic acid 를 처리하였을 때 PDH의 인산화가 증가하는 것을 확인하였다. 이 결과로 LDHB의 발현저하로 lactic acid가 축적되고, 그 결과 PDH가 불활성화되어 미토콘드리아가 호흡 기능이 저하됨을 알 수 있었다. 이러한 과정에서 증가된 lactic acid에 의해 ERK가 활성화되고, 이로 인해 PDK가 활성화되어 PDH가 불활성화 됨을 확인하였다.
본 연구를 통해, 기존에 알려진 암세포의 대사전환 현상인 미토콘드리아의 기능 손상으로 해당과정 활성화가 유도되는 기전 외에, LDHB발현 저하로 일어난 해당과정 활성화로 미토콘드리아 기능 손상이 유도될 수 있다는 새로운 대사전환 기전을 밝힐 수 있었다.
43
핵심어: 간암세포주, 미토콘드리아 기능손상, 해당과정, LDHB (lactate dehydrogenase B), PDH (pyruvate dehydrogenase), Lactic acidosis, Hepatoma cell