저작자표시-비영리-변경금지 2.0 대한민국 이용자는 아래의 조건을 따르는 경우에 한하여 자유롭게 l 이 저작물을 복제, 배포, 전송, 전시, 공연 및 방송할 수 있습니다. 다음과 같은 조건을 따라야 합니다: l 귀하는, 이 저작물의 재이용이나 배포의 경우, 이 저작물에 적용된 이용허락조건 을 명확하게 나타내어야 합니다. l 저작권자로부터 별도의 허가를 받으면 이러한 조건들은 적용되지 않습니다. 저작권법에 따른 이용자의 권리는 위의 내용에 의하여 영향을 받지 않습니다. 이것은 이용허락규약(Legal Code)을 이해하기 쉽게 요약한 것입니다. Disclaimer 저작자표시. 귀하는 원저작자를 표시하여야 합니다. 비영리. 귀하는 이 저작물을 영리 목적으로 이용할 수 없습니다. 변경금지. 귀하는 이 저작물을 개작, 변형 또는 가공할 수 없습니다.
석사학위논문
전신마취유도 동안 사연속자극으로 측정된 근이완제의
최대효과시간(
tpe
)을 이용한 효과처평형속도상수(
ke0
)의 추정
Estimation of the effect-site equilibration rate constant (
k
e0)
using the time to peak effect (
tpe
) of muscle relaxants
measured by train-of-four stimulation during general
anesthesia induction
제주대학교 대학원
의학과
박세연
2016년 12월
Estimation of the effect-site equilibration rate constant (
k
e0)
using the time-to-peak effect (
tpe
) of muscle relaxants
measured by train-of-four stimulation during general
anesthesia induction
Se Yeon Park, M.D.
(Supervised by professor Jong Cook Park)
December, 2016
Department of Anesthesiology and Pain Medicine
GRADUATE SCHOOL
Estimation of the effect-site equilibration rate constant (
k
e0)
using the time-to-peak effect (
tpe
) of muscle relaxants
measured by train-of-four stimulation during general
anesthesia induction
Se Yeon Park, M.D.
(Supervised by professor Jong Cook Park)
A thesis submitted in partial fulfillment of the requirement for the degree of Master of Medicine [Department of Anesthesiology and Pain medicine]
December, 2016
This thesis has been examined and approved.
Department of Anesthesiology and Pain Medicine
GRADUATE SCHOOL
Contents
List of tables --- 5
Legend of figures --- 6
Abstract --- 7
Introduction --- 8
Materials and methods --- 9
Results --- 11
Discussion --- 12
Conclusions --- 14
Appendix --- 15
5
List of tables
Table 1. Patients characteristics --- 18
Table 2. Comparison of the time-to-peak effect (tpe) and the effect-site equilibration rate constant (ke0) in
each muscle relaxants --- 19
6
Legend of figures
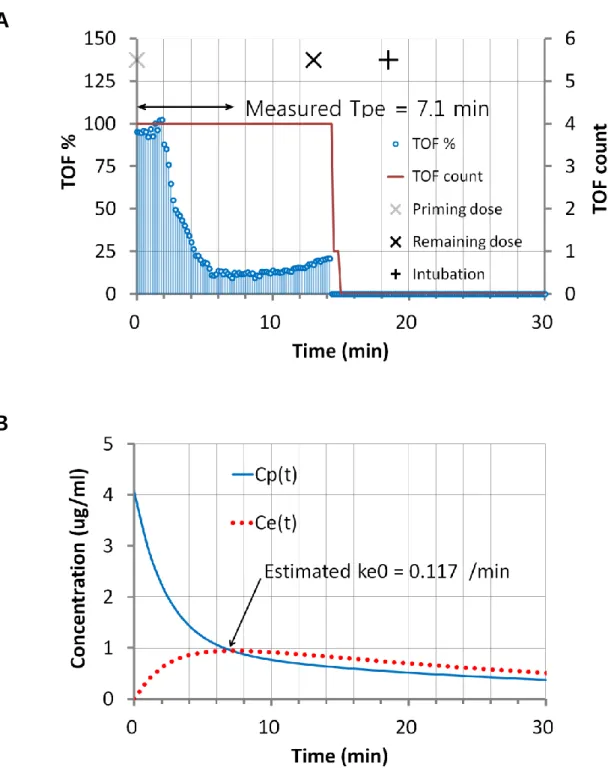
Fig. 1. A: Graphic representation of the induction-course of a rocuronium-induced non-depolarizing neuromuscular blockade in one patient. Measured tpe is obtained the time-to-peak effect by using TOF
(train-of-four).
B: Concentrations and time courses of plasma and effect-site. Estimated ke0 is the calculated value by the
measured time-to-peak effect. --- 21
Fig. 2. Comparison of the time-to-peak effect (tpe) & the effect-site equilibration rate constant (ke0) of
7
Abstract
Background: The concept of effect-site concentration in anesthetic agents is important. The effect
compartment model can be explained the concepts of the effect-site concentration and the effect-site equilibration rate constant (ke0). The effect-site equilibration rate constant can be calculated by
measurement of the time-to-peak effect (tpe) of muscle relaxants.
Methods: Eighty patients administered general anesthesia were divided into the succinylcholine,
rocuronium, atracurium, or vecuronium groups. Priming doses of muscle relaxants were administered. The effects of muscle relaxants were quantified by recording the twitch response of the adductor pollicis muscle after stimulating the ulnar nerve. The time to peak effect was measured at the lowest train-of-four value. The effect-site equilibration rate constant was calculated by using the measured time-to-peak effect.
Result: The effect-site equilibration rate constants of the succinylcholine, rocuronium, atracurium and
vecuronium groups were 0.076 ± 0.030 /min, 0.228 ± 0.122 /min, 0.062 ± 0.011 /min and 0.077 ± 0.019 /min.
Conclusion: Estimation of the effect-site equilibration rate constant by measurement of the time-to-peak
effect of muscle relaxants during general anesthesia induction is possible.
Key words: Effect-site equilibration rate constant, General anesthesia, Muscle relaxants, Time-to-peak
8
서론
마취에서 사용되는 약물은 시간과 농도의 개념이 중요하다. 안전한 마취를 하기 위해서는 약제의 발현 시간과 용량-반응 관계(dose-response relationship)의 의미를 정확하게 알고 있어야 한다. 약물이 효과를 보이기 시작하는 시점이 약물의 발현시간(onset time)이며, 그 효과가 최대로 나타나는 시점이 최대약효시간(time-to-peak effect, tpe)이다. 혈중 농도가 최대인 점에서 최대의 효과를 보인다고 할 수 없는데, 이는 혈액이 약물의 작용 부위가 아니고 약물을 작용 부위로 운반하는 매개체이기 때문에 효과를 대변할 수 있는 효과처 농도의 개념이 필요하게 된다. 효과처 농도가 최대인 때가 최대약효시간이라고 할 수 있으며, 약물을 투여하면 혈중 농도는 최대치에서 점점 감소하고 효과처 농도는 서서히 증가하여, 혈중 농도와 효과처 농도가 같아지게 되는 지점의 시간이다.효과처 농도를 설명하기 위해 고안된 것이 효과처 구획 모형(effect compartment model)이며, 이 모형에서 파생된 개념인 효과처와 혈장 사이의 일차 속도상수가 효과처평형속도상수(effect-site equilibration rate constant, ke0)이다.
최대약효시간은 약동학적 모수와 효과처평형속도상수에 의해 결정되며, 동일한 약동학적 특성을 보이는 약물에서 효과처평형속도상수가 클수록 최대약효시간은 빨라진다1. 약물의 효과처평형속도상수는 일회 용량 투여 후 최대약효시간을 측정하여 추정하거나 지속정주 동안 효과처 농도-반응곡선을 평가하여 구할 수 있는데 1,2, 우리는 전신마취의 유도 동안 사연속자극(train-of-four, TOF)을 적용하여 측정한 근이완제의 최대약효시간을 이용해서 효과처평형속도상수를 추정해 보았다.
9
대상 및 방법
전신 상태에 영향을 줄 수 있는 질환이 아닌 중이염 혹은 만성비염 등의 질환에 의해 전신마취 하 정규수술을 받는 80 명의 환자를 대상으로, 제주대학교병원 임상연구심의위원회의 승인(IRB file No.2015-12-004-001) 후 환자에게 실험에 대해 설명하고 서면으로 동의서를 작성하였다. 연구 대상자수는
기존의 연구를 참고하여 선정하였다 3. 대상자들은 미국마취과학회 신체등급 분류(American society of
anesthesiologists class) 1 혹은 2 에 해당되며, 미국마취과학회 신체등급 분류 3 이상이거나 신경근질환자, 근이완제의 대사에 영향을 미치는 간질환자 및 신질환자, 신체비만지수(body mass index,
BMI) 18.5 – 30.0 kg/m2을 벗어나는 저체중과 고도비만 환자들은 대상에서 제외되었다. 연구에 동의한
80 명의 환자들을 무작위로 succinylcholine, rocuronium, atracurium, vecuronium 군으로 나누어 각 군당 20 명이 되도록 분류하였다.
환자는 수술실에 입실하여 앙와위로 누운 상태에서 표준감시장치인 비침습적 자동혈압계, 심전도, 맥박산소포화도 적용 하에 감시되었다. 비침습적 자동혈압계를 하지 않은 쪽 손의 엄지와 검지에 mechanosensor (neuromuscular transmission module, M-NMT, Datex-Ohmeda, USA)를 설치하고, 손목 부위의 척골신경이 지나는 위치에 체표전극을 부착하였다. 전산소화 후, thiopental sodium 5 mg/kg 을 정주하고 100% 산소와 3 - 5% sevoflurane 을 사용하여 마취유도를 시작하였다. 70 mA 까지 극대자극으로 척골신경을 자극하여 대조값을 측정하고 사연속자극을 매 10 초마다 감시하였다. 근이완제를 생리식염수로 희석하여 succinylcholine chloride (Succicholine, Ilsung Pharm. Co., Korea) 10 mg/ml, rocuronium bromide (Kabi rocuronium, Fresenius Kabi Korea) 10 mg/ml, atracurium besylate (Atra, Hana Pharm. Co., Korea) 10 mg/ml, vecuronium bromide (Vecaron, Reyon Pharm. Co., Korea) 1 mg/ml 로 준비하여, 애벌 용량(priming dose)으로 일반적인 마취 유도에서 사용되는 근이완제 용량의 5 분의 1 정도를 투여한 후 사연속자극에서 가장 낮은 측정값이 나온 때(Fig. 1A), 즉 효과처 농도가 최대인 시간을 측정하고 기록하였다(Fig. 1B). 애벌 용량은 succinylcholine 0.2 mg/kg, rocuronium 0.1 mg/kg, atracurium 0.1 mg/kg, vecuronium 0.01 mg/kg 을 사용하였다. 여기서 측정된 최대약효시간(measured
10
tpe)을 이용하여 추정한 효과처평형속도상수(estimated ke0)를 구했다. Cortinez et al.4 이 사용한,
최대효과시간으로부터 효과처평형속도상수를 추정한 방법을 이용하였고, 부록에서 설명하고 있다. 가장 낮은 사연속자극값을 보인 후 20% 이상의 상승 값이 나타나면 나머지 근이완제 용량(remaining dose)인 5 분의 4 를 더 투여하고 사연속자극이 0% 를 나타낼 때 기관내 삽관을 시행하였다. 자료 수집
프로그램(S/5® collect, Datex-Ohmeda Co., USA)을 사용하여 측정된 사연속자극값을 실시간으로
저장하였다.
측정된 최대효과시간을 가지고 각각의 효과처평형속도상수를 추정한 후 모든 값을 평균 ± 표준 편차로
표시하였고, 통계적 처리는 SPSS® Statistics 24 (IBM®, USA)를 사용하여 분석하였다. 측정한
최대약효시간 및 추정한 효과처속도평형상수의 각 군 간 비교를 위해 일원분산분석(One-way ANOVA)으로 분석한 후 Bonferroni 로 사후 검정했다. P < 0.05 를 통계적 유의 수준으로 간주하였다.
11
결과
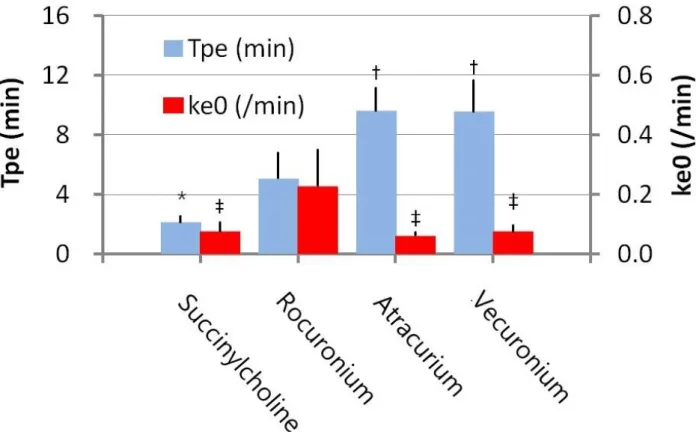
근이완제 네 군의 환자 특성을 표에 나타냈으며, 각 군간 유의한 차이는 없었다(Table 1). 각 군의 근이완제에서 측정한 최대약효시간은 succinylcholine 군이 2.2 ± 0.4 분, rocuronium 군이 5.1 ± 1.7 분이었으며, atracurium 군과 vecuronium 군은 9.6 ± 1.5 분과 9.6 ± 2.1 분을 보였다. 측정한 최대약효시간을 사용하여 추정한 효과처평형속도상수는 succinylcholine 군에서 0.076 ± 0.030 /min, rocuronium 군에서 0.228 ± 0.122 /min, atracurium 군에서 0.062 ± 0.011 /min, vecuronium 군에서 0.077 ± 0.019 /min 의 값을 나타냈다.Rocuronium 군은 최대약효시간과 효과처평형속도상수에서 다른 모든 군과 통계적 차이를 보였고, 최대약효시간은 atracurium 군과 vecuronium 군에서, 효과처평형속도상수는 succinylcholine 군과 atracurium 및 vecuronium 군에서 서로 차이가 없었다(Fig. 2).
12
고찰
임상에서 약물의 발현 시간은 알기 쉽지만 최대약효시간은 알기가 쉽지 않다. 근이완제의 최대약효시간을 얻기 위해 전신 마취 유도 중 사연속자극을 적용하여, 효과처 농도가 최대에 달하는, 즉 사연속자극이 최소를 보이는 시간을 일반적 마취 유도에서 사용되는 근이완제 용량의 5 분의 1 정도를 투여해서 측정할 수 있었다. 소량의 근이완제 투여로 효과처평형속도상수를 구할 수 있는 것은선형약동학(linear pharmacokinetics) 원리에 따라 투여 용량(dose, D)에 의해 혈장 농도나 소실양은
비례하지만 약물의 효과처평형속도상수는 영향을 받지 않기 때문이다5. 사연속자극은 약물 농도와 효과의 정량적 관계를 알 수 있는 방법으로 약물 투여 후 가장 낮은 수치가 나타날 때가 최대약효시간이라고 할 수 있으며, 비침습적이고 사용이 간편하며 비용적인 측면에서 장점을 가진다. 최대약효시간으로 효과처평형속도상수를 추정하는 방법은 약물 작용의 전 과정이 없더라도, 약물 작용의 일부분만을 가지고도 구할 수 있는 이점이 있으며 6, 마취유도 동안의 약물 효과 측정만으로도 가능하다. 효과처평형속도상수를 계산하는 고비용의 상품화된 프로그램이 아닌 우리 연구에서 구성한
Excel® 2007 (Microsoft, USA) 프로그램을 사용하여, 최대약효시간을 가지고 비교적 손쉽게
효과처평형속도상수를 추정할 수 있고, 이 프로그램은 근이완제가 아닌 다른 약물에도 모의해 볼 수 있는 이점이 있다. 효과처평형속도상수는 효과처까지 분포용적을 알 수 있기 때문에 초기 부하용량을 구할 수 있고, 최대약효시간을 알 수 있으며, 추가 투여량과 시점을 결정할 수 있게 해준다. 따라서 전신마취에서 근이완제의 효과처평형속도를 알고 있는 것은 중요하다. 마취영역에서 흔히 사용되는 네 종류의 근이완제 모두에서 최대약효시간을 측정하여 효과처평형속도상수를 추정했기 때문에 동일한 연구 설계에서 각기 다른 근이완제를 사용하여 추정한 효과처평형속도상수라는 의의를 가진다고 할 수 있다. 결과에서 보듯이 동일한 근이완제를 사용하였어도 환자마다 측정한 최대약효시간에 편차가 있는 것을 알 수 있는데, 각각의 최대약효시간을 가지고 효과처평형속도상수를 추정한 뒤 평균 ± 표준편차로
13
나타냈기 때문에 효과처평형속도상수의 추정에도 개인 간 편차가 영향을 미쳤을 것으로 예상된다. 하지만 동일한 약제를 같은 양으로 투여해도 나타나는 효과가 사람마다 다른 것은 시간과 농도의 곡선이 개인마다 다른 약동학적 변이(pharmacokinetic variability)와 같은 농도에서도 반응이 사람마다 다른 약력학적 변이(pharmacodynamic variability)때문이며, 이는 집단분석(population analysis)을 통하여 극복할 수 있다.
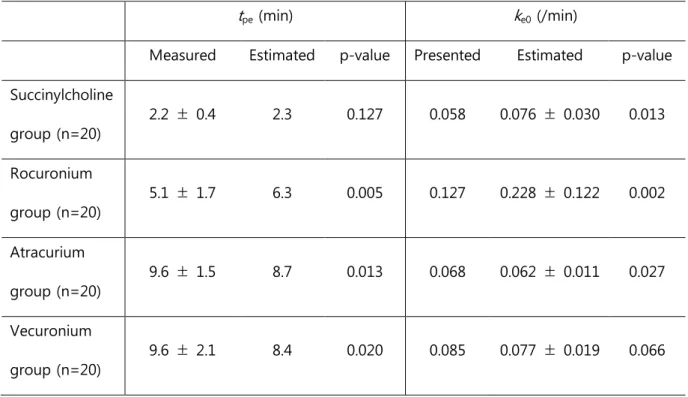
측정한 최대약효시간을 가지고 효과처평형속도상수를 추정한 뒤, 다른 연구에서 제시된
효과처평형속도상수(presented ke0)와 비교해 보았다. 부록의 등식을 이용하면 제시된
효과처평형속도상수로부터 추정한 최대효과시간(estimated tpe)을 구할 수 있다. 측정한 최대약효시간과
추정한 최대약효시간의 비교 및 제시된 효과처평형속도상수와 추정한 효과처평형속도상수의 각 군 내 비교는 단일모집단 평균검증(one sample t-test)을 하고, P < 0.05 를 통계적 유의 수준으로 간주하였다(Table 2).
Succinylcholine 군의 최대약효시간과 vecuronium 군의 효과처평형속도상수는 유의한 차이가 없었고, 나머지 군에서는 통계적 차이를 보였다.
이와 같은 결과가 나온 것은 rocuronium 과 같은 경우 본 연구에서 비교를 위해 사용한 효과처평형속도상수는 0.127 /min 이였지만, 그 연구에서 조차 효과처평형속도상수를 0.127 /min 과 0.09
/min 두 가지 다른 값으로 제시하고 있었고 7, atracurium 의 경우에도 우리가 사용한 0.068 /min 과는
다른 값인 0.043 /min 을 효과처평형속도상수로 제시한 연구도 있었다 8. 본 연구와 다른 연구들에서의 차이는 마취약제가 isoflurane 혹은 propofol 이었다는 것과, 효과 측정을 위해서 사연속자극 혹은 단일연축(single twitch)을 사용했다는 것이다. 흡입마취제는 근이완의 효과를 강화시키기 때문에 근이완효과를 측정에 영향을 미쳤을 가능성이 높고, 효과 측정에 사용된 사연속자극과 단일연축의 경우, 민감도는 높지만 특이도가 낮은 검사 방법으로 연구에서 변수로 작용했을 것으로 보인다. 반면에 여러 연구에서 다양한 약동학적 모수를 제시하고 있었지만, 각 군의 근이완제에서 동일한 약동학적 모수를 선택하여 효과처평형속도상수와 최대약효시간을 추정했기 때문에 이로 인한 차이는 없었을 것으로 생각된다.
14
결론
전신마취유도 동안 사연속자극으로 측정한 근이완제의 최대약효시간을 이용하여 효과처평형속도상수를 추정할 수 있었으며, 개인 간 최대약효시간 및 효과처평형속도상수에서 편차가 있을 수 있는 것을 확인 할 수 있었다. 다른 연구에서 제시한 효과처평형속도상수와 서로 비교하고, 그 효과처평형속도상수를 가지고 역으로 추정한 최대약효시간을 본 연구의 최대약효시간과 비교 및 검증을 해볼 수 있었다. Succinylcholine, rocuronium 및 atracurium 은 여러 연구에서 각기 다른 효과처평형속도상수를 제시한 것처럼 본 연구에서도 다른 효과처평형속도상수를 나타냈는데, 이런 결과가 도출된 원인에 대한 연구가 추후 더 필요할 것으로 생각된다.15
부록
혈장농도 Cp(t)는 용량요법(dosage regimen, D(t))과 단위배치함수(unit disposition function, UDF(t))의
합성곱(convolution)이며 다음과 같은 등식으로 정리될 수 있다.
Equation [1]
여기서 연산기호 ⊗ 는 합성곱을 나타낸다. 시간 t 가 0 에서 용량이 1 일 때 Cp(t)는 UDF(t)가 되며
다구획모형의 UDF(t)는 다음 등식으로 나타낸다.
Equation [2] 여기서 𝐴𝑖 는 계수(coefficient), 𝜆𝑖 는 지수(exponent)이며 Table 3 과 같은 구획용적(Volume, Vi)과
미세속도상수(micro-rate constant, kij)로부터 구해진다.
구획모형(compartment models)에서 효과처구획(effect-site compartment)은 효과처평형속도상수를 가지게 되며, 효과처 구획의 용적이 거의 없고 중심구획과의 약물이동은 무시할 수준이라고 할 때 효과처 농도(effect-site concentration, Ce(t))는 다음 등식과 같다5. Equation [3] 최대약효시간에서 효과처농도의 증감율은 0 이 되므로 효과처농도의 도함수 𝐶𝑒′(𝑡) 가 0 인 시간이 최대약효시간이며 다음 등식에 효과처평형속도상수를 대입하면 최대약효시간을 추정할 수 있다5. Equation [4] 반대로 임상에서 측정한 최대약효시간에서 효과처평형속도상수를 추정할 수 있는데, 측정된 최대약효시간에서 혈장농도와 효과처농도는 평형이기 때문에 두 농도의 차의 제곱이 가장 작은 효과처평형속도상수를 다음 등식으로 구할 수 있다5. Equation [5] 이 공식들을 가지고 측정한 최대약효시간을 대입하여 효과처평형속도상수를 도출할 수 있고, 반대로, 제시된 효과처평형속도상수를 사용하여 최대약효시간을 추정할 수 있는 프로그램을 Excel® 2007
16
(Microsoft, USA)을 사용하여 구성하였다. 각 근이완제에서 사용한 약동학적 모수(phamarcokinetic parameters)는 Table 3 에 나타냈다.
17
참고문헌
1. Minto CF, Schnider TW, Gregg KM, Henthorn TK, Shafer SL. Using the time of maximum effect site concentration to combine pharmacokinetics and pharmacodynamics. Anesthesiology. 2003;99(2):324-333.
2. van Meurs WL, Nikkelen E, Good ML. Pharmacokinetic-pharmacodynamic model for educational simulations. IEEE transactions on bio-medical engineering. 1998;45(5):582-590.
3. Park JC, Park KS. Comparison of Pharmacodynamics and Intubation Conditions of Muscle Relaxants Using a Continuous Infusion during Induction. Kor J Anesth. 2006;50(3):250~255. 4. Cortinez LI, Nazar C, Munoz HR. Estimation of the plasma effect-site equilibration rate constant
(ke0) of rocuronium by the time of maximum effect: a comparison with non-parametric and parametric approaches. Br J Anaesth. 2007;99(5):679-685.
5. Park JC. How to design intravenous anesthetic dose regimens based on pharmacokinetics and pharmacodynamics principles. Anesth Pain Med. 2015:235-244.
6. Billard V, Gambus PL, Chamoun N, Stanski DR, Shafer SL. A comparison of spectral edge, delta power, and bispectral index as EEG measures of alfentanil, propofol, and midazolam drug effect. Clin Pharmacol Ther. 1997;61(1):45-58.
7. Dragne A, Varin F, Plaud B, Donati F. Rocuronium pharmacokinetic-pharmacodynamic relationship under stable propofol or isoflurane anesthesia. Can J Anaesth. 2002;49(4):353-360.
8. Roy JJ, Varin F. Physicochemical properties of neuromuscular blocking agents and their impact on the pharmacokinetic-pharmacodynamic relationship. Br J Anaesth. 2004;93(2):241-248.
9. Roy JJ, Donati F, Boismenu D, Varin F. Concentration-effect relation of succinylcholine chloride during propofol anesthesia. Anesthesiology. 2002;97(5):1082-1092.
10. Wierda JM, Kleef UW, Lambalk LM, Kloppenburg WD, Agoston S. The pharmacodynamics and pharmacokinetics of Org 9426, a new non-depolarizing neuromuscular blocking agent, in patients anaesthetized with nitrous oxide, halothane and fentanyl. Can J Anaesth. 1991;38(4 Pt 1):430-435.
11. Kitts JB, Fisher DM, Canfell PC, et al. Pharmacokinetics and pharmacodynamics of atracurium in the elderly. Anesthesiology. 1990;72(2):272-275.
12. Sohn YJ, Bencini AF, Scaf AH, Kersten UW, Agoston S. Comparative pharmacokinetics and dynamics of vecuronium and pancuronium in anesthetized patients. Anesth Analg. 1986;65(3):233-239.
13. Donati F, Gill SS, Bevan DR, Ducharme J, Theoret Y, Varin F. Pharmacokinetics and pharmacodynamics of atracurium with and without previous suxamethonium administration. Br J Anaesth. 1991;66(5):557-561.
14. Alloul K, Whalley DG, Shutway F, Ebrahim Z, Varin F. Pharmacokinetic origin of carbamazepine-induced resistance to vecuronium neuromuscular blockade in anesthetized patients. Anesthesiology. 1996;84(2):330-339.
18 Table 1. Patients characteristics
Succinylcholine group (n=20) Rocuronium group (n=20) Atracurium group (n=20) Vecuronium group (n=20) Age (yr) 48.0 ± 17.0 47.2 ± 16.3 48.2 ± 16.5 51.0 ± 10.8 Gender (M/F) 13 / 7 13 / 7 14 / 6 7 / 13 Body weight (kg) 64.7 ± 13.1 65.5 ± 14.7 65.8 ± 8.3 64.2 ± 12.5 Hight (cm) 163.7 ± 10.6 162.5 ± 11.6 164.9 ± 7.3 160.0 ± 8.3 BMI (kg/m2) 23.9 ± 2.9 24.6 ± 3.9 24.1 ± 2.2 24.9 ± 3.6
Values are expressed as mean ± standard deviation (SD). BMI: body mass index.
19
Table 2. Comparison of the time-to-peak effect (tpe) and the effect-site equilibration rate constant (ke0) in
each muscle relaxants
tpe (min) ke0 (/min)
Measured Estimated p-value Presented Estimated p-value
Succinylcholine group (n=20) 2.2 ± 0.4 2.3 0.127 0.058 0.076 ± 0.030 0.013 Rocuronium group (n=20) 5.1 ± 1.7 6.3 0.005 0.127 0.228 ± 0.122 0.002 Atracurium group (n=20) 9.6 ± 1.5 8.7 0.013 0.068 0.062 ± 0.011 0.027 Vecuronium group (n=20) 9.6 ± 2.1 8.4 0.020 0.085 0.077 ± 0.019 0.066
Values are expressed as mean ± standard deviation (SD).
References of the presented ke0 (/min): succinylcholine9, rocuronium7, atracurium13, vecuronium14
tpe (min): time-to-peak effect
20 Table 3. Pharmacokinetic parameters for muscle relaxants
Succinylcholine : Roy et al.9 (2002) Rocuronium : Wierda et al.10 (1991) Atracurium : Kitts et al.11 (1990) Vecuronium : Sohn et al.12 (1986) k10 (/min) 5.0 ± 2.6 0.1 0.166 0.099 ± 0.049 k12 (/min) 2.9 ± 3.9 0.21 0.217 0.23 ± 0.18 k21 (/min) 1.6 ± 0.4 0.13 0.123 0.19 ± 0.12 k13 (/min) - 0.028 - 0.086 ± 0.024 k31 (/min) - 0.01 - 0.013 ± 0.007 V1 (L/kg) 0.009 ± 0.003 0.045 0.032 0.048 ± 0.02 V2 (L/kg) 0.016 0.073 0.068 0.054 ± 0.031 V3 (L/kg) - 0.126 - 0.38 ± 0.22
21
A
B
Fig. 1. A: Graphic representation of the induction-course of a rocuronium-induced non-depolarizing neuromuscular blockade in one patient. Measured tpe is obtained the time-to-peak effect derived by
using train-of-four (TOF).
B: Concentrations and time courses of plasma and effect-site. Estimated ke0 is the value calculated using
22
Fig. 2. Comparison of the time-to-peak effect (tpe) and the effect-site equilibration rate constant (ke0) of
muscle relaxants.
*: P < 0.05 compared with rocuronium group. †: P < 0.05 compared with rocuronium group. ‡: P < 0.05 compared with rocuronium group.