저작자표시-비영리-변경금지 2.0 대한민국 이용자는 아래의 조건을 따르는 경우에 한하여 자유롭게 l 이 저작물을 복제, 배포, 전송, 전시, 공연 및 방송할 수 있습니다. 다음과 같은 조건을 따라야 합니다: l 귀하는, 이 저작물의 재이용이나 배포의 경우, 이 저작물에 적용된 이용허락조건 을 명확하게 나타내어야 합니다. l 저작권자로부터 별도의 허가를 받으면 이러한 조건들은 적용되지 않습니다. 저작권법에 따른 이용자의 권리는 위의 내용에 의하여 영향을 받지 않습니다. 이것은 이용허락규약(Legal Code)을 이해하기 쉽게 요약한 것입니다. Disclaimer 저작자표시. 귀하는 원저작자를 표시하여야 합니다. 비영리. 귀하는 이 저작물을 영리 목적으로 이용할 수 없습니다. 변경금지. 귀하는 이 저작물을 개작, 변형 또는 가공할 수 없습니다.
Thesis for the Degree of Doctor of Philosophy
Studies on metabolomic analysis with
immortalized mesenchymal stem cells
by SV40 T-antigen
Ajou University Graduate School
Department of Biomedical Sciences
Studies on metabolomic analysis with
immortalized mesenchymal stem cells
by SV40 T-antigen
Gwang Lee, Advisor
I submit this thesis as the
Doctoral thesis in Ajou University Graduate School
August 2017
Ajou University Graduate School
Department of Biomedical Sciences
The Doctoral thesis of Jeom Soon Shim in Graduate School of
Ajou University is hereby approved.
Thesis Defense Committee President
Yup Kang
Committee Member Gwang Lee
Committee Member Soo Hwan Lee
Committee Member Chan Bae Park
Committee Member Yongman Kim
Ajou University Graduate School
i
ABSTRACT OF DISSERTATION
This study was carried out by transfection of SV40 T antigen into mesenchymal stem cell hMSCs collected from human bone marrow. Immortalized hMSCs-T cell is a mesenchymal stem cell capable of multiple cell division. The cell cycle of hMSCs was relatively short, but the hMSCs-T cell was able to divide more than 80 passages. The amount of amino acids (AAs) in the cell was measured by gas chromatography in order to examine the metabolism of the cell according to the elongated cell cycle. Amino acids are the key component of protein synthesis and intracellular nitrogen. In addition, we aimed to study the amino acid alteration and find a biomarker that can support the continuous growth of cells that are capable of continuous production for the industrial use of immortalized stem cells. The alterations of amino acids in mesenchymal stem cells and immortalized stem cells are summarized in chapter 1.
Beside hMSCs-T cell, HEK293 transfected with synphilin-1 also altered the amino acid composition. Synphilin-1 is aα-synuclein interacting protein in Lewy body, which is a characteristic of Parkinson's disease. When HEK293 and S293, HEK293 stably overexpressed synphilin-1, were starved with KRBB buffer, the morphological changes and cell aggregations were different between cell types. The difference might be from intracellular metabolites and protein compositions. Amino acid sensing pathway is controlled by the intracellular and extracellular amount of amino acid and changes of amino acids are important factors in controlling protein synthesis and degradation. The mammalian target of rapamycin (mTOR) is important in amino acid sensing that regulates cell growth and cell survival. This study was conducted to estimate the amount of amino acid and detect the phosphorylation of S6K1 and Akt influenced by mTORC1 and mTORC2. HEK293 and S293 were starved and challenged with glutamine, glutamic acid, and proline to confirm the amino acid alteration induced from synphilin-1. The results of amino acid and biological data were described in chapter 2.
ii
CONTENT
ABSTRACT OF DISSERTATION ... i
LIST OF TABLES ... v
LIST OF FIGURES ... vi
Chapter1. Studies on metabolomics analysis with immortalized mesenchymal stem cells by SV40 T-antigen ... 1
1.1. Abstract ... 2
1.2. Introduction ... 3
1.3. Materials and Methods ... 5
1.3.1. Chemicals and reagents ... 5
1.3.2. Cell culture and transfection ... 5
1.3.3. Cell preparation and cell lysis ... 5
1.3.4. Preparation of standard solutions ... 6
1.3.5. Sample preparation for amino acid assays ... 6
1.3.6. Gas chromatography-Mass spectrometry ... 7
1.3.7. Data analysis ... 7
1.3.8. Statistical analysis ... 7
1.4. Results ... 10
iii
1.4.2. Composition changes of amino acid with hydrophobic side chain in hMSCs and
hMSCs-T cells ... 13
1.4.3. Composition changes of amino acid with negatively charged side chain in hMSCs and hMSCs-T cells ... 14
1.4.4. Changes of amino acids with electrically positive charged side chains and special cases in hMSCs and hMSCs-T cell. ... 15
1.5.Discussions ... 16
Chapter 2. Studies on metabolomic analysis in synphilin-1 over-expressing HEK293 cells ... 18
2.1. Abstract ... 19
2.2. Introduction ... 20
2.3. Materials and methods ... 24
2.3.1. Cell culture and transfection ... 24
2.3.2. Preparation of cell lysate for metabolic analysis ... 24
2.3. 3. Preparation of standard solutions for GC-MS. ... 25
2.3.4. Sample preparation for amino acid assays ... 25
2.3.5. Gas chromatography–mass spectrometry ... 25
2.3.6. Cell starvation and restimulation ... 26
2.3.7. Western blot analysis ... 26
iv
2.3.9. Statistical analysis ... 27
2.4. Results ... 28
2.4.1. Morphological observations for HEK293 and S293 ... 28
2.4.2. Phosphorylation of S6K1 and Akt in HEK293 and S293 ... 28
2.4.3. Quantification of amino acids as EOC/TBDMS derivatives ... 31
2.4.3.1. Changes of amino acid with hydrophobic side chain ... 32
2.4.3.2. Changes of amino acid with polar uncharged side chains... 36
2.4.3.3. Changes of amino acid with electrically negative charged side chains ... 36
2.4.3.4. Changes of amino acid with electrically positive charged side chains and special cases ... 39
2.4.4. Time-dependent expression of phosphorylated S6K1 ... 42
2.4.5. Dose-dependent expression of S6K1-pT389 by amino acids. ... 43
2.4.6. Expression of S6K1-pT389 and Akt-pS473 in HEK293 and S293 ... 44
2.5. Discussions ... 47
2.6. References ... 50
v
LIST OF TABLES
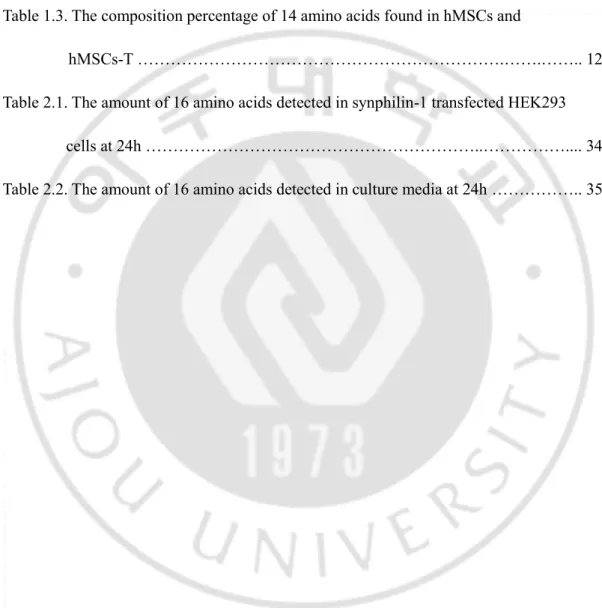
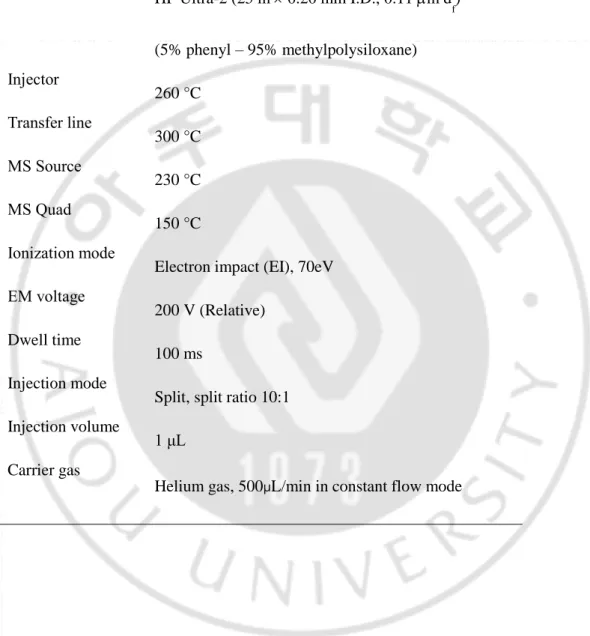
Table 1.1. Operating conditions for GC-MS analysis ……….. 9 Table 1.2. Linearity of GC-MS response of amino acids as EOC/TBDMS derivatives…..11 Table 1.3. The composition percentage of 14 amino acids found in hMSCs and
hMSCs-T ……….…….…….. 12 Table 2.1. The amount of 16 amino acids detected in synphilin-1 transfected HEK293
cells at 24h ………..……….... 34 Table 2.2. The amount of 16 amino acids detected in culture media at 24h ……….. 35
vi
LIST OF FIGURES
Figure 1.1. Sequential EOC/TBDMS for analysis of amino acids ……….…….. 8 Figure 1.2. SIM chromatograms of amino acids as ethoxycarbonyl/tert-butyldimethyl
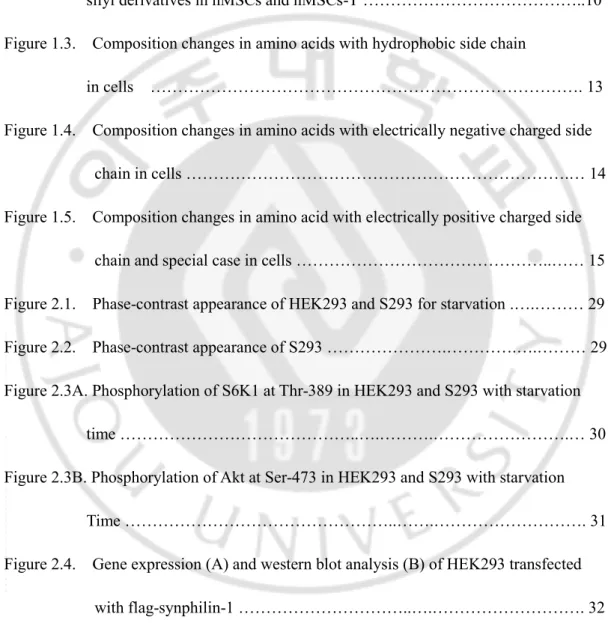
silyl derivatives in hMSCs and hMSCs-T ………..10 Figure 1.3. Composition changes in amino acids with hydrophobic side chain
in cells ………. 13 Figure 1.4. Composition changes in amino acids with electrically negative charged side
chain in cells ……….… 14 Figure 1.5. Composition changes in amino acid with electrically positive charged side
chain and special case in cells ………..…… 15 Figure 2.1. Phase-contrast appearance of HEK293 and S293 for starvation .….……… 29 Figure 2.2. Phase-contrast appearance of S293 ……….………….….……… 29 Figure 2.3A. Phosphorylation of S6K1 at Thr-389 in HEK293 and S293 with starvation
time ………..….……….……….… 30 Figure 2.3B. Phosphorylation of Akt at Ser-473 in HEK293 and S293 with starvation
Time ………..…….………. 31 Figure 2.4. Gene expression (A) and western blot analysis (B) of HEK293 transfected
with flag-synphilin-1 ………..….………. 32 Figure 2.5A. Changes in amino acid with hydrophobic side chain in cells …………...… 37
vii
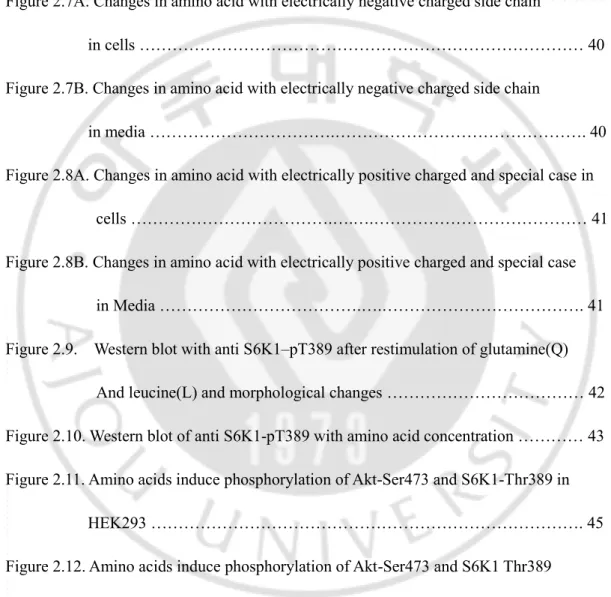
Figure 2.5B. Changes in amino acid with hydrophobic side chain in media ………. 37 Figure 2.6A. Changes in amino acid with polar uncharged side chain in cells ……….… 38 Figure 2.6B. Changes in amino acid with polar uncharged side chain in media …….….. 38 Figure 2.7A. Changes in amino acid with electrically negative charged side chain
in cells ……… 40 Figure 2.7B. Changes in amino acid with electrically negative charged side chain
in media ……….………. 40 Figure 2.8A. Changes in amino acid with electrically positive charged and special case in
cells ……….….….……… 41 Figure 2.8B. Changes in amino acid with electrically positive charged and special case
in Media ……….….………. 41 Figure 2.9. Western blot with anti S6K1–pT389 after restimulation of glutamine(Q)
And leucine(L) and morphological changes ……… 42 Figure 2.10. Western blot of anti S6K1-pT389 with amino acid concentration ………… 43 Figure 2.11. Amino acids induce phosphorylation of Akt-Ser473 and S6K1-Thr389 in
HEK293 ………. 45 Figure 2.12. Amino acids induce phosphorylation of Akt-Ser473 and S6K1 Thr389
1
Chapter1. Studies on metabolomics analysis with
immortalized mesenchymal stem cells by SV40 T-antigen
2
1.1. Abstract
Human bone marrow-derived mesenchymal stem cells (hMSCs) are capable of self-replication and differentiation into various tissue lineages, attracting attention as tools for use in cell therapy. However, hMSCs have a very poor proliferative capacity and a short life span in culture. To overcome this problem, we expressed the T antigen of SV40 in hMSCs because it was known to have the ability to elevate the growth rate of various primary animal cells. We obtained several hMSCs lines (hMSCs-T) known for stable expression of T antigen. Cells expressing T antigen proliferated on the monolayer of hMSCs, forming high-density foci. hMSCs-T showed changed morphology and improved growth rate and life span and demonstrated preservation of the potential for differentiation into osteoblasts. In addition, hMSCs-T did not proliferate in soft agar culture, indicating that the cells did not transform into tumor cells. In order to evaluate the metabolic change of amino acids in hMSCs-T compared to primary hMSCs, we investigated altered amino acids (AA) with gas chromatography-mass spectrometry MS) in selected ion monitoring (SIM) mode (GC-SIM-MS). A total of 14 AAs were positively measured. Results from the Student’s t-test on the hMSCs group mean of the hMSCs-T group showed significantly elevated levels of glycine, proline, pipecolic acid, aspartic acid, lysine, and tryptophan, whereas valine, leucine, and isoleucine as branched-chain amino acids (BCAAs), and phenylalanine showed a significant decrease. Altered AAs metabolic pattern in the hMSCs-T may explain the disturbance of AA metabolism related to the expression of SV40 T antigen in hMSCs.
_______________________________________________________________________ Keywords : amino acid, gas chromatography-mass spectrometry, hMSCs, immortalized cell line, SV40 T antigen
3
1.2 Introduction
Stem cells are multipotent cells that are able to differentiate and mature into various and distinct cell lineages. It is this ability of stem cells that make them potentially ideal candidates for use in stem cell therapy [1, 2]. Mesenchymal stem cells (MSCs), which exist in various tissues including bone marrow, umbilical cord, and adipose tissue, can differentiate into osteoblasts, chondrocytes, adipocytes, and hepatocytes. The possibility that they might be able to transdifferentiate into other phenotypes as well, including neuronal cells, has been suggested [3, 4]. In particular, human bone marrow-derived mesenchymal stem cells (hMSCs) have been used as tools for cell therapy due to their ability of self-renewal and differentiation into various tissue lineages[5]. However, hMSCs have very a poor proliferative capacity and a short life span, which is an impediment in biological analysis and application to therapy. Therefore, in order to obtain consistent results in the biological investigation using hMSCs, it is necessary to isolate single cell-derived clones of hMSCs that have a capacity for proliferation in long-term culture.
For immortalization of primary cells, v-myc, telomerase and SV 40 T antigen have been used [6-8]. Among them, v-myc was used for immortalization of human neuronal stem cells using a retroviral vector encoding v-myc, and the immortalized cells expressed NSC-specific markers including nestin [9]. Although v-myc is a good candidate gene for immortalization of stem cells, it has been known as a typical oncogene and its transformed cells showed that a heavy percentage of cells underwent apoptosis, which was dependent on the tumor suppressor P53 pathway [6]. On the other hand, the T antigen of Simian virus 40 (SV40) is known to have the ability to immortalize and transform various animal cells [8]. From studies conducted over several decades after SV40 was found as a contaminant of vaccines prepared from cultures of monkey cells in 1960, the proposition that the T antigen might be involved in human carcinogenesis was virtually dismissed, despite evidence showing that it was highly tumorigenic in rodents. Therefore, SV40 T antigen might be a novel candidate as a
4
tool for the establishment of hMSCs lines maintaining the non-tumoral and normal phenotype.
To investigate metabolic changes following stable expression of T antigen in hMSCs, amino acids were analyzed, because amino acids occurring in metabolic pathways are important indicators for cellular physiological and pathological conditions including cell signal, oxidative stress, synthesis of ATP, and utilization of nutrients [10, 11]. In our previous report, we demonstrated that a two-phase aqueous ethoxycarbonyl (EOC) derivatization combined with tert-butyldimethylsilyl (TBDMS) reaction and subsequent gas chromatography–mass spectrometry in selected ion monitoring mode (GC-SIM-MS) method was useful for rapid screening and monitoring of biologically important amino acids in biological samples in the presence of co-extracted endogenous metabolites[12].
This study was to detect the composition percentage of amino acids between hMSCs and a growth-elevated cell line of hMSCs by stably expressing SV40 T antigen and to compare which amino acid can change according to cell immortalization.
5
1.3. Materials and Methods
1.3.1. Chemicals and reagents
14 amino acids, norvaline as the internal standard (IS), and ethylchloroformate (ECF) were purchased from Sigma-Aldrich (St. Louis, MO, USA). N-Methyl-N-(tert-butyldimethylsilyl) trifluoroacetamide (MTBSTFA) was obtained from Thermo Scientific (Bellefonte, PA, USA). Toluene, diethyl ether, ethyl acetate and dichloromethane (pesticide grade) were obtained from Kanto Chemical (Tokyo, Japan). Sulfuric acid and sodium hydroxide were bought from Duksan (Seoul, South Korea) and all other chemicals were of analytical grade.
1.3.2. Cell culture and transfection
Human mesenchymal stem cells from bone marrow (hMSCs) were purchased from PromoCell GmbH (Germany). The hMSCs-T ( hMSC stably expressed with SV40 T antigen) were cultured in high glucose DMEM (Invitrogen) containing 10% fetal bovine serum (Invitrogen) and 1% penicillin/ streptomycin and were incubated under a humidified atmosphere of 5% CO2 at 37°C. Subconfluent cultures of hMSCs were transfected with
pEF321-T plasmid DNA (20 µg/10 cm plate) using Fugene 6 (Roche Molecular Biochemicals) [13]. Plasmid DNA was mixed with FuGENE 6 transfection reagent in serum-free DMEM for 15 min at room temperature and applied to culture plates according to manufacturer’s instruction.
1.3.3. Cell preparation and cell lysis
To prepare the cell lysate, hMSCs and hMSCs-T cells were harvested by trypsinization and centrifugation at 1,300 rpm for 3 min. The cells were rinsed with phosphate buffered
6
saline (PBS) and made into a pellet of 1X10⁶ cells for analysis of amino acids. The cells
were lysed by the sequential freeze-thaw method. Briefly, an adequate volume of water was added to the cell to make the mixture containing approximately 106 cells/ml. The
specimens were placed in a -80oC freezer for 10 min (until frozen) and then immediately
heated at 35oC for 15 min. This process was repeated for the total of 6 cycles.
1.3.4. Preparation of standard solutions
Each amino acid stock solution was made up at 10μg/μl in 0.1M HCl, and then standard working solutions of 0.01 and 0.5μg/μl were made by diluting each stock solution with 0.1M HCl as previously reported[14]. Briefly, the internal standard (IS) stock solution, prepared by dissolving 10.0 μg/μL in methanol, was used to make an IS working solution of 0.02 μg/μL in methanol. The mixed calibration samples were prepared at five concentrations ranging from 0.01 μg/mL to 5.0 μg/mL by mixing appropriate aliquots of each working solution. All standard solutions were stored at 4°C until used.
1.3.5. Sample preparation for amino acid assays
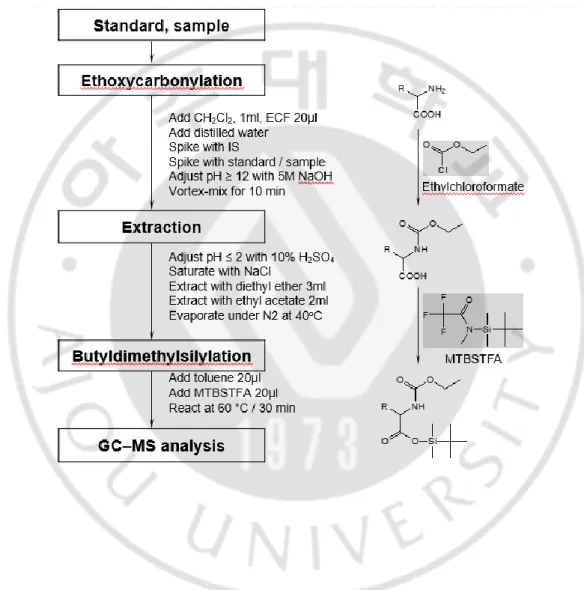
Amino acids in hMSCs and hMSCs-T cells were identified by GC-MS using selected ion monitoring (SIM) after conversion to ethoxycarbonyl (EOC)/tert-butyldimethylsilyl (TBDMS) derivatives as previously reported[14]. Briefly, 200 ng norvaline (IS) was added to each aliquot of cells (equivalent to 1X10⁶ cells), pH was adjusted to ≥12 (using 5.0 M
NaOH), and the cells were immediately vortexed (10 min) at room temperature after the second addition of ECF (20 μL). Then solvent extraction using diethyl ether (3 mL) and ethyl acetate (2 mL) was performed step by step. The extracts were evaporated under a gentle stream of nitrogen (40°C). The residue was reacted (60°C for 30 min) using MTBSTFA (20 μL) in toluene (20 μL) for analysis (Fig. 1.1).
7
1.3.6. Gas chromatography-Mass spectrometry
All derivative samples were analyzed using an Agilent 6890N gas chromatography interfaced to an Agilent 5975B mass-selective detector (70 eV, electron impact mode ionization source) in scan mode for the elucidation of mass spectra, or in selected ion monitoring (SIM) mode for quantitative assay. Ultra-2 (Agilent Technologies, Santa Clara, CA, USA), cross-linked capillary column coated with 5% phenyl-95% methylpolysiloxane bonded phase (25 m × 0.20 mm i.d., 0.11 µm film thickness) was used for all analyses as described in our previous reports[4] and the operating conditions are listed in Table 1.1.
1.3.7. Data analysis
The concentration of each amino acid in hMSCs and hMSCs-T was determined on the basis of calibration curves. The amino acid levels in hMSCs-T were normalized to the corresponding mean in the hMSCs group
1.3.8. Statistical analysis
The composition ratios of amino acid were listed as the mean ± standard deviation (SD) and statistical analyses were performed using a t-test on SigmaStat software (SigmaStat version 2.03 for Windows). A p value < 0.05 was considered statistically significant.
8
9
Table 1.1. Sequential EOC/TBDMS for analysis of amino acids
column Injector Transfer line MS Source MS Quad Ionization mode EM voltage Dwell time Injection mode Injection volume Carrier gas HP Ultra-2 (25 m 0.20 mm I.D., 0.11 m d f) (5% phenyl – 95% methylpolysiloxane) 260 °C 300 °C 230 °C 150 °C
Electron impact (EI), 70eV 200 V (Relative)
100 ms
Split, split ratio 10:1 1 μL
10
1.4. Results
1.4.1. SIM Chromatogram of amino acid as EOC/TBDMS derivatives
Derivatives of amino acids were made by a two-phase ethoxycarbonyl reaction with ethyl chloroformate for amino groups and by tert-butyldimethylsilylation with MTBFTFA for carboxylic functions for analysis by GC-MS. 14 amino acids were positively detected and the calibration curve was brought into being linear in the 0.02 – 5.0 μg/ml with correlation coefficients from 0.987 – 0.999 (Fig. 1.2, Table 1.2, Table 1.3).
Figure 1.2. SIM chromatograms of AAs as ethoxycarbonyl/tert-butyldimethylsilyl derivatives in hMSCs (A) and hMSCs-T (B). SIM chromatograms reveal the changed
11
Table 1. 2. Linearity of GC-MS response of amino acids as EOC/TBDMS derivatives
Amino acid Slope(m) Intercept (b) Linearity (R)a
Alanine Glycine Valine Leucine Isoleucine Proline Aspartic acid Glutamic acid Lysine Tyrosine Tryptophan 1.3753 1.4737 1.2718 1.0215 0.5156 1.1975 0.7261 0.3838 0.2826 0.0004 0.5476 0.1446 0.1570 0.0634 -0.3293 -0.0533 -0.0010 -0.4340 -0.2718 -0.2684 -0.0003 -0,4594 0.9999 0.9999 0.9998 0.9998 0.9999 0.9999 0.9979 0.9945 0.9888 0.9946 0.9913 aCorrelation coefficient
13
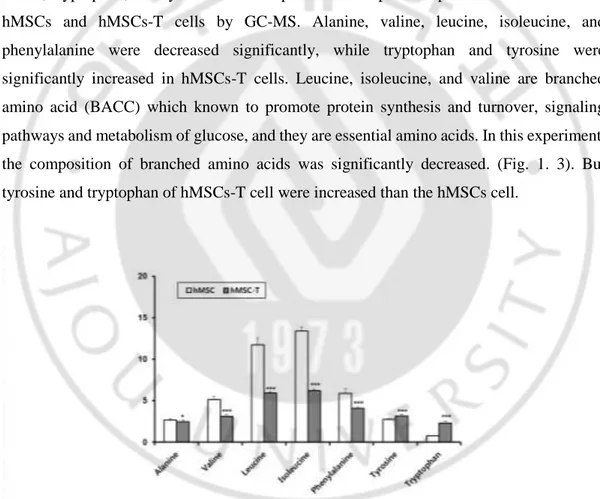
1.4.2. Composition changes of amino acid with hydrophobic side chain in hMSCs and hMSCs-T cells
The amino acids are synthesized into a polypeptide chain on the ribosome during synthesis of protein by the peptide bond. 20 different amino acids are commonly finding in nature and they have their specific characteristics defined by the side chain, which is responsible for it with its unique role in a protein structure and special function.
Amino acid with hydrophobic side chain are leucine, isoleucine, phenylalanine, alanine, valine, tryptophan, and tyrosine and compared the composition percent of amino acid in hMSCs and hMSCs-T cells by GC-MS. Alanine, valine, leucine, isoleucine, and phenylalanine were decreased significantly, while tryptophan and tyrosine were significantly increased in hMSCs-T cells. Leucine, isoleucine, and valine are branched amino acid (BACC) which known to promote protein synthesis and turnover, signaling pathways and metabolism of glucose, and they are essential amino acids. In this experiment, the composition of branched amino acids was significantly decreased. (Fig. 1. 3). But tyrosine and tryptophan of hMSCs-T cell were increased than the hMSCs cell.
Figure 1.3. Composition changes in amino acid with hydrophobic side chain in cells.
14
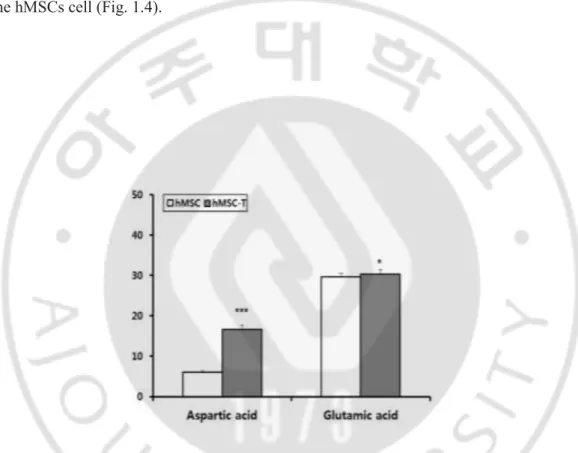
1.4.3. Composition changes of amino acid with negatively charged side chain in hMSCs and hMSCs-T cells
Amino acids with electrically negative charged side chain were aspartic acid and glutamic acid. glutamic acid and aspartic acid and in hMSCs-T cells were significantly increased than
the hMSCs cell (Fig. 1.4).
Figure 1.4. Composition changes in amino acid with electrically negative charged side chain in cells. The levels of the amino acid with negative uncharged side chain were detected
15
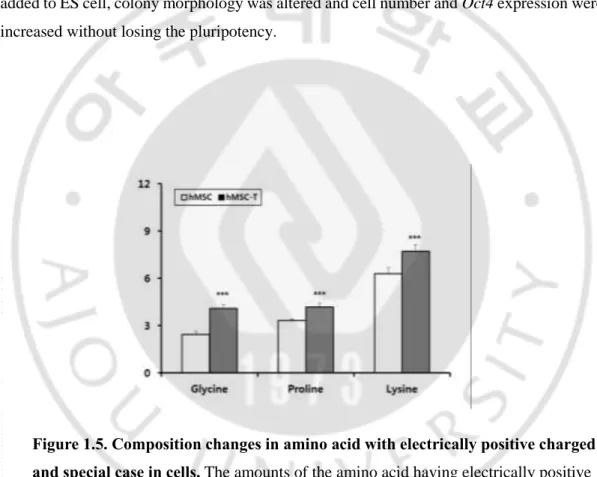
1.4.4. Changes of amino acids with electrically positive charged side chains and special cases in hMSCs and hMSCs-T cell.
Amino acid with electrically positive charged side chain is lysine and amino acids with special cases are glycine and proline (Fig. 1.5). Glycine, lysine, and proline were increased with T-antigen transfection. L-proline may induce the differentiation of ES cells and has a unique role in regulating the pluripotent cells in culture[15]. When 200 μM of proline was added to ES cell, colony morphology was altered and cell number and Oct4 expression were increased without losing the pluripotency.
Figure 1.5. Composition changes in amino acid with electrically positive charged and special case in cells. The amounts of the amino acid having electrically positive
16
1.5. Discussions
This study is to detect the amino acid alterations in the established growth-elevated hMSCs lines (hMSCs-T) by expressing SV40 T antigen in normal hMSCs. The hMSCs-T maintained cellular characteristics of hMSCs showing differentiation potential into the osteoblast. hMSCs-T showed anchorage-dependent growth characteristics indicating that the cells are not transformed into the tumor cell. Of particular interest, although the level of expressed T antigen was maintained constantly, the proliferative life-span of the established cell lines in this study was restricted to approximately 80 passages for a period of 6 months, suggesting that other additional growth stimulating factors are required for permanent immortalization. Maintenance of primary phenotype and differentiation potential is the most important prerequisite for the establishment of cell lines of hMSCs.
Early spontaneous immortalization is generally known to result in loss of plasticity of bone marrow mesenchymal stem cells and the fully transformed tumor cells lose the ability for differentiation. However, the hMSCs-T line, which was established in this study by SV40 T antigen, obtained an increased ability for growth and maintained the surface markers and the potential for differentiation. This result was consistent with previous reports of a stable human mesenchymal stem cell line derived from fetal marrow, which was immortalized by v-myc [16].
This is the first demonstration of changes in amino acid patterns that may explain the growth improvement of hMSCs related to alterations in amino acid metabolism. As shown by our metabolic data, aspartic acid and tryptophan level of hMSCs-T were dramatically increased more than 2-fold. We assume that the increase of aspartic acid has a role in the donation of one nitrogen atom in the biosynthesis of inosine, the precursor to the purine bases for DNA synthesis in hMSCs-T, and aspartic acid is highly produced from oxaloacetate by transamination due to TCA cycle activation in hMSCs-T[17]. In the case of tryptophan, marrow derived stem cells were reported to be regulated in gene expression through the
17
complement of enzymes in the kynurenine pathway (KP) of tryptophan metabolism, which in turn plays a role in maintaining the balance between proliferation and differentiation [18]. Over expression of T antigen may lead to significant increase of tryptophan in the stem cellular milieu because T antigen is known to regulate a large number of gene expression of above 400 genes[19]. On the other hand, branched chain amino acids (BCAAs), including valine, leucine, and isoleucine, were decreased by approximately 40 ~ 50% compared with normal hMSCs. According to previous reports, more than 30% of glutamic acids in cells are synthesized from BCAAs through the transaminase pathway, and glutamic acids are deaminated to α-glutaric acid which is an essential molecule in the TCA cycle [20]. We assume that higher proliferation of hMSCs-T is caused by TCA cycle activation, consuming glutamic acids synthesized from BCAAs. Further studies are needed for evaluation of TCA cycle related metabolites and activation of branched-chain alpha-keto acid dehydrogenase complex (BCKDH) to explain the metabolic changes in highly proliferative hMSCs-T in detail.
18
Chapter 2. Studies on metabolomic analysis in
synphilin-1 over-expressing HEK293 cells
19
2.1. Abstract
Synphilin-1 is well known as α-synuclein interacting protein (SNCAIP) and interacts both
in vitro and in vivo with α-synuclein promoting its aggregation. Lewy body is the hallmark
originated from the postmortem brain of the patient with Parkinson’s disease and is toxic to neurons. However, the physiological function of this protein in neurodegenerative disease is not well understood. Amino acid levels are important signs for explaining the biochemical and physiological phenomenon in pathological states. Thus we studied human embryonic kidney 293 (HEK293) cells transfected with synphilin-1 to investigate the biological influence of synphilin-1 on amino acid alteration and phosphorylation of S6K1 and Akt influenced by amino acids. Gas chromatography-mass spectrometry in the selected ion monitoring mode was used to detect a number of amino acids as their tert-butyldimethylsilyl derivatives. The level of glutamic acid, glutamine, and proline was significantly increased in cells overexpressing synphilin-1 after transfection. The amount of amino acid with hydrophobic aliphatic side chain was decreased but tyrosine and tryptophan, having an aromatic ring, were increased dose-dependently. The phosphorylation of S6K1 and Akt was increased when the glutaminolysis related amino acid of glutamine, glutamic acid, and proline was added in HEK293 and S293, synphilin-1 over-expressing HEK293, after starvation.
These results indicate that synphilin-1 might alter cellular amino acid and modulate Akt/PI3K/mTOR signaling pathway according to the different amount of glutaminolysis related amino acid detected by using GC-MS.
___________________________________________________________________
20
2.2. Introduction
Parkinson’s disease (PD) is the second popular neurodegenerative disease that is characterized by stiffness, bradykinesia, tremor, drooping posture, and gait disturbance[21, 22]. Patients with Parkinson’s disease have usually lost over 80% of the dopaminergic neuron in their substantia nigra and the vast majority of cases occur after the age of60. The neuropathological hallmark is well-defined by the serious loss of dopaminergic neurons in the substantia nigra pars compacta (SNpc) [22, 23] and the presence of Lewy bodies, eosinophilic intracytoplasmic proteinaceous inclusions, and Lewy neuritis in surviving neurons. The molecular pathways leading to the distinct pathological feature and concomitant clinical syndromes are completely unknown, but they may partially result from an environmental factor, a genetic causation or a combination of both. Epidemiological studies reveal that less than 10% of PD patients have a strict familial etiology while most patients are generally sporadic. The discovery of genes related to special familial forms of PD during the last decades have confirmed the role of genetics in the development of PD and provided important clues in understanding the molecular pathogenesis of the common sporadic disorder. These genetic discoveries give us with unique evidence to explain the pathologic mechanisms and help us find the probable targets for developing neuroprotective therapies[24].
Synphilin-1 consists of 919 amino acids which have the coiled-coil domain, ankyrin-like repeats, and ATP-binding motifs[25, 26]. The presynaptic synphilin-1 interacts with many proteins including α-synuclein, parkin, leucine-rich repeat kinase-2 (LRRK2), other ubiquitin ligases, and proteasome subunit/regulators, and has been related to the protein aggregation like Lewy body in PD patients[27, 28]. The gene of synphilin-1 is expressed in a number of tissues and its expression is enriched in the brain[29]. The co-transfection of
α-synuclein and synphilin-1 in mammalian cell culture results in the formation of intracytoplasmic protein inclusions similar to Lewy bodies in PD patients. Succeeding
21
experiments have revealed that the proteinaceous inclusions in transfected cells are made by overexpression of synphilin-1 [27].
Mammalian target of rapamycin (mTOR), a serine/threonine protein kinase, is highly evolutionally conserved protein from yeast to human, which contributes a number of stimuli to control cell growth, cell metabolism, and aging. mTOR consists of two functionally and structurally distinct complexes , mTORC1 (comprising mTOR, Raptor, PRAS40, and mLST8) and mTORC2 (comprising mTOR, Rictor, mSIN1, PROTOR1, and mLST8)[30]. Regulation of mTORC1 is influenced by nutritional ingredient, growth factors, cellular bioenergetics (controlled by the AMPK pathway), and oxygen availability[31]. The Rag GTPase, a member of the Ras GTPase superfamily, activates mTORC1 in response to a lot of amino acids, especially leucine. Rag GTPases activated by amino acids is mediated by a GEF complex termed Ragulator, any by a double GAP component, termed GATOR1 and
GATOR2. The supplement of amino acids let the Rag heterodimer to recruit mTORC1
nearby the lysosome to activate mTORC1. Therefore, according to the current model, the activation of the catalytic GEF activity of Ragulator and the inhibition of the GATOR system are two key steps in the activation of mTORC1 of amino acids. To date, the molecular mechanism of the activation of Ragulator and GATOR by amino acids is not well understood. Glutaminolysis process that produces α-ketoglutarate (αKG) by the deamination of glutamine, is an important in the Rag-dependent recruitment of mTORC1 to the lysosome [30, 32], but the molecular mechanism connecting glutaminolysis and mTORC1 has not been clarified yet.
Protein kinase B(PKB)/Akt, the serine/threonine specific protein kinase, is one of the most important multifunctional kinases that control the metabolism, stress response and apoptosis in the cell. Mammalian cells have three highly homologous members that alluded to the PKBα/ Akt1, PKBβ/Akt2, and PKBγ/Akt3[33, 34]. Akt is activated by the growth factor receptor, which is recognized to be tyrosine kinase and wortmannin-sensitive [35]. The activated PKB/Akt moves to the cell membrane and binds to PI(3,4,5)P3 and PI(3,4)P2 through its pleckstrin homology (PH) domain. The threonine residue (Thr-308) of Akt is
22
phosphorylated by 3-phosphoinositide-dependent kinase 1(PDK1), which is also recruited to the cell membrane [36] while the serine residue (Ser-373) is activated by mammalian target of rapamycin complex 2 (mTORC2) [37] under growth factor or by DNA dependent protein kinase(DNA-PK) upon DNA damage[38]. These two phosphorylation steps are necessary to activate Akt completely[39]. When the two amino acids of Akt are phosphorylated and activated, it triggers the phosphorylation process of cytoplasmic and nuclear proteins that mediate downstream responses, including cell growth, cell survival, differentiation, proliferation and cell migration. Akt inhibits transcription factors related to cell death and enhances the transcription of anti-apoptotic genes including cAMP response element binding protein (CREB) and IKKα via phosphorylation and inhibiting the expression of proteases, including caspase 9 [40, 41]. PI3K and Akt are mostly found in the cytoplasm but also detected within the nucleus [42-44]. When the cell responses to the stimuli, they translocate into the nucleus [45]. After stimulation by growth factors, Akt is translocated into the nucleus after 20~30 min, and it influences the Forkhead box transcription factors, FKHR, FKHRL1, and AFX, via the phosphorylation of FOXOs. The phosphorylated FOXOs inhibit their ability to promote the expression of death genes [46, 47]. Akt has also been shown to phosphorylate the p53 tumor suppressor and inhibit of p53-mediated apoptosis [48]. The nuclear targets of Akt include nuclear SRK (S6 kinase-related kinase) and Nur77, a transcription factor that has previously been implicated in T-cell receptor-mediated apoptosis[49, 50]. The phosphorylated Akt acts directly actin filament and involved in polymerization and stabilization of the actin cytoskeleton [51] and girdin, Akt phosphorylation enhancer, was phosphorylated at Serine1416 to cause translocation to the leading edge of essential filament for migration[52]. Another target of Akt is zyxin, a focal adhesion protein, and palladin, the component of microfilaments maintained cell shape, adhesion, and contraction [53-55].
The neuronal apoptosis was regulated by neutrophins through phosphorylation or interaction with downstream mediator proteins in PI3K/Akt cascade and other PI3K/Akt signals are implicated in neuronal differentiation through glycogen synthase kinase 3β
23
cascade reaction into the downstream mediates and protects from apoptotic stimulation in the nucleus [45, 56].
The amino acid is a building block of protein and has the important function to regulate biological metabolism in the cell. Amino acid signaling has two principal pathways, the amino acid responsive (AAR) pathway and the mammalian target of rapamycin complex 1 (mTORC1) pathway. When cells are deprived of amino acids, mTORC1 is diffuse throughout the cytoplasm and regulate the localization of mTORC1 [57]. Extracellular amino acids cross the membrane to activate mTORC1nearby lysosome. When the amino acid is added, mTORC1 rapidly translocates into the lysosomal surface where act together with the small GTPase Rheb [32]. The localization of mTORC1 to the lysosome is mediated by the raptor of mTORC1 [57]. Thus, it appears that the main purpose of the amino acid signal is to colocalize mTORC1 with its activator Rheb on the lysosomal surface. In addition to mTORC1 activation, amino acids can mediate mTORC2 by PI3k/Akt signaling. At first, thr-308 is phosphorylated by PDK1 and next Ser-473 is phosphorylated by rictor, a specific component of mTORC2[58].
This study was conducted to investigate the different responses in the growth pattern of HEK293 and S293, synphilin overexpressed HEK293, and detect the degree of phosphorylation of S6K1 and Akt, which are important mediators of intracellular Akt / PI3K /mTOR pathway. In other to know the cellular level of amino acid, we detect the amount of amino acids between HEK293 and synphilin-1 transfected HEK293 by using GC-MS. The phosphorylation of S6K1 and Akt was confirmed by adding the changed amino acid.
24
2.3. Materials and methods
2.3.1. Cell culture and transfection
Human embryonic kidney 293 (HEK293) cell was obtained from American Type Culture Collection (ATCC) and cultured as supplier’s instruction. S293, HEK293 cells stably overexpressed FLAG-tagged synphilin-1, was presented by Dr. Lee for starvation. Cells were cultured in DMEM, Dulbecco’s high-glucose modified Eagle’s medium ( Gibco, USA) supplemented with 10% fetal bovine serum (Gibco, USA), 100 units/ml penicillin, and streptomycin (Gibco, USA) and incubated in a 5% humidified CO2 incubator at 37°C. To
study for metabolic alteration, HEK293 cells were seeded and transfected with pCMV-Tag 2 (Stratagene, La Jolla, CA, USA) containing flag-synphilin-1 using CalPhos TM mammalian
transfection kit (Clontech, USA) according to manufacturer’s manual and cultured for 24 h. The transfected cells were harvested after trypsinization and made pellet using centrifugation at 1300 rpm for 3 min and washed three times in PBS for GC-Mass Spectroscopy and further studies.
2.3.2. Preparation of cell lysate for metabolic analysis
To prepare cell lysate, HEK 293 and synphilin-1 transfected HEK293 cells were incubated in the CO2 incubator at 37℃ under 5% CO2 humidified atmosphere for 24h. Cells were
harvested by trypsinization and collected by centrifugation at 1,300 rpm for 3 min. The cells were rinsed 3 times with phosphate buffered saline (PBS) and then carried out trypan blue dye exclusion as a method to determine cell viability. Aliquot of 1 Χ 106cells was collected
25
2.3. 3. Preparation of standard solutions for GC-MS
The stock solution of each amino acid was made up at 10 μg/μL in 0.1 M HCl. Standard
working solutions of 0.01 and 0.5 μg/μL were then prepared by diluting each stock solution
with 0.1 M HCl as previously reported[14, 59]. The internal standard (IS) stock solution, prepared by dissolving at 10.0 μg/μL in methanol, was used to make an IS working solution
of 0.02 μg/μL in methanol. The mixed calibration samples were prepared at five concentrations ranging from 0.01 to 5.0 μg/mL by mixing appropriate aliquots of each
working solution. All standard solutions were stored at 4 °C.
2.3.4. Sample preparation for amino acid assays
Amino acids in mock control and synphilin-1 transfected HEK293 cells were identified by GC-MS using selected ion monitoring (SIM) after conversion to ethoxycarbonyl (EOC)/tert-butyldimethylsilyl (TBDMS) derivatives as previously reported[12]. Briefly, 200 ng norvaline (IS) was added to each aliquot of cells (equivalent to 3X10⁵ cells), pH was
adjusted to ≥12 (using 5.0 M NaOH), and the cells were immediately vortexed (10 min) at room temperature after the second addition of ECF (20 μL). Then solvent extraction using diethyl ether (3 mL) and ethyl acetate (2 mL) was performed step by step. The extracts were evaporated under a gentle stream of nitrogen (40°C). The residue was reacted (60°C for 30 min) using MTBSTFA (20 μL) in toluene (20 μL) for analysis.
2.3.5. Gas chromatography–mass spectrometry
GC-MS was performed with an Agilent 6890N gas chromatography interfaced to an Agilent 5975B mass-selective detector (70 eV, electron impact mode) equipped with an Ultra-2 (5% phenyl–95% methylpolysiloxane bonded phase; 25 m × 0.20 mm i.d., 0.11 μm film thickness) cross-linked capillary column (Agilent Technologies, Palo Alto, CA, USA) as previously reported [12]. Briefly, the temperatures of the injector, interface, and ion source were 260°C, 300°C, and 230°C, respectively. Helium was used as the carrier gas at a flow
26
rate of 0.5 mL/min in constant flow mode. Samples were introduced in split-injection mode (10:1) and the oven temperature was set initially at 120 °C (2 min) and programmed to rise to 240°C at 5°C/min and finally to 300°C (3 min) at 30°C/min. The mass range scanned was 50–600 u at a rate of 0.99 scans/s. In the SIM mode, three characteristic ions for each amino acid were used for peak identification, while one bold ion was selected for quantification. A dwell time of 100 ms was chosen for all ions. The relative voltage of the electron multiplier was set to 300 V higher than that in the scanning mode (1200 V) for each ion monitoring. Each peak in samples was identified by matching the area ratios of the three ions with those of the amino acid standards. All GC-SIM-MS runs were performed in triplicate. [12]
2.3.6. Cell starvation and restimulation
For standard amino acid starvation, cells were incubated in Krebs-Ringer Bicarbonate Buffer (KRBB) (HEPES 25mM, NaCl 111mM, NaHCO3 25mM, KCl 5mM, CaCl2 2.5mM
and MgCl2 1mM) supplemented with glucose(4.5g/l) and insulin (100nM) and restimulated
with various concentration of amino acids. Starvation time was 1h and 24h and restimulation time with amino acid was 15 min and 60min.
2.3.7. Western blot analysis
Cells were lysed in RIPA lysis buffer (50mM Tris- HCl, pH7.6, 150mM NaCl, 1% TRITOT-X100, 1% sodium deoxycholate, 0.1% SDS, 2mM EDTA) supplemented with Xpert protease inhibitor (GenDEPOT, USA). The lysate was centrifuged at 14,000ⅹg for 15minutes at 4 °C and determined the protein concentration using Bio-Rad Protein assay with bovine serum albumin as a standard. Equal amounts of proteins were analyzed by SDS-polyacrylamide gel electrophoresis and transferred to Nitrocellulose membrane. The membrane was blocked with 5% skim milk in TBST for one hour and incubated with anti-FLAG (Sigma, 1: 2000) and anti-β-actin (Abcam, 1:5000), S6K1(Cell Signaling Tech., 1:000), phosphor-T389 S6K1(Cell Signaling Tech., 1:500), Akt(Cell Signaling Tech.,
27
1:1000), phosphor-S473 Akt(Cell Signaling Tech., 1:500) which were diluted with TBST at 4 °C with gentle shaking. After washing, the membrane was incubated with the HRP-goat anti-mouse or anti-rabbit IgG (H+L) conjugate antibody (Santa Cruz, 1:2000) and was visualized with ECL (Amersham Bioscience, USA).
2.3.8. Total RNA isolation and semi-quantitative RT-PCR assays
Total RNA was extracted using RNAzolB (Tel-Test Inc., Friendswood, TX, USA) and RNeasy Mini Kit (Qiagen, USA). One μg of RNA was used to synthesize cDNA using AmfiRivert cDNA synthesis master mix (GenDEPOT). synphilin-1 (SNCAIP) and glyceraldehyde 3-phosphate dehydrogenase (GAPDH) were synthesized by using Thermocycler T3000 PCR machine (Whatman Biometra, Goettingen, Niedersachsen, Germany) using amfiSure PCR Premix (GenDEPOT). The primer for GAPDH is CATGACCACAGTCCATGCCATCACT and TGAGGTCCACCACCCTGTTGCTGTA and for synphilin-1 is TGAGGAAGGCTGACCGACCA and TTGTGGAGGTCCGCTG GAGA. Each band amplified by RT-PCR was normalized against GAPDH expression to remove relative quantitative template errors. The PCR products were identified on 1% agarose gel and visualized by ethidium bromide staining.
2.3.9. Statistical analysis
The concentration of amino acid in cells was expressed as the mean ± standard deviation (SD) and statistical analyses were performed using Student’s t-test. The values of p<0.05 were considered statistically significant.
28
2.4. Results
2.4.1. Morphological observations for HEK293 and S293
Phase-contrast micrographs showed that HEK293 and S293 cells in confluent
monolayers spread throughout the plate surface, displaying spindle shape and
fibroblast-like morphology. When they are starved with Krebs-Ringer Bicarbonate
Buffer containing glucose (4.5g/l) and insulin (100nM), the cell density of HEK293
was decreased, although they retained their position with rough membrane
appearance. The cells were changed their shape and the starved cells were
contracted their size with many sprouts. In contrast to HEK293, S293 cells were
slowly gathered together with the formation of cytoplasmic projection. The
aggregated S293 were arrayed into the elongated clusters at 18h and 24h with the
changes in cell number (Fig. 2.1). The elongated filaments from the S293 were
connected with the neighboring cells and made aggregates (Fig. 2.2).
2.4.2. Phosphorylation of S6K1 and Akt in HEK293 and S293
Amino acid activated not only mTORC1 but also mTORC2. Phosphorylation of S6K1, downstream mediator of mTORC1, was increased in HEK293 than S293 (Fig. 2.3A). Akt is phosphorylated at Thr-308 and Ser-473 and phosphorylation of Ser-473 was related with mTORC2. When HEK293 and S293 were starved for 30min, 1h, and 24h, Ser-473 phosphorylation of Akt in S293 cell was more increased than the HEK293 cell (Fig. 2.3B).
29
Figure 2.1. Phase-contrast appearance of HEK293 and S293 for starvation.
The photography was captured with Olympus CKX41 inverted microscope and
Olympus digital camera was connected with DMC advanced program for
efficient documentation tasks and archiving (X100)
Figure 2.2. Phase-contrast appearance of S293. The photography was
captured with Olympus CKX41 inverted microscope and Olympus digital
camera was connected with DMC advanced program for efficient tasks (X200).
30
Figure 2.3A. Phosphorylation of S6K1 at Thr-389 in HEK293 and S293
with starvation time.
31
Figure 2.3B. Phosphorylation of Akt at Ser-473 in HEK293 and S293 with starvation time.
2.4.3. Quantification of amino acids as EOC/TBDMS derivatives.
To compare simultaneously amino acid alteration between HEK293 and S293 cells, HEK293 was transfected with pCMV-Tag 2 (Stratagene, La Jolla, CA, USA) containing flag-synphilin-1 as described previously using CalPhos TM mammalian transfection kit
32
(Clontech, USA) according to manufacturer’s instructions and cultured for 24 h. HEK293 and S293, synphilin-1 expressed HEK293 cell, were harvested and lysed to analyze derivative of amino acids using GC-MS (Table 2.1, Table 2.2). The synphilin-1 was entered into the cells successfully and confirmed with semi-quantitative RT-PCR using synphilin-1 primer and GAPDH and immunoblotting (Figure 2.4).
Figure 2.4. Gene expression (A) and Western blot analysis(B) of HEK293 transfected with flag-synphilin-1.
2.4.3.1. Changes of amino acid with hydrophobic side chain
Amino acid with hydrophobic side chain is alanine, valine, leucine, isoleucine, phenylalanine, tryptophan, and tyrosine. HEK293 was transfected with vehicle, 8μg, and 24μg of pCMV-Tag 2 synphilin-1 for 24 h into HEK293 and detected the amount of amino acid by GC-MS. Alanine, valine, leucine, and isoleucine were decreased dose independently while phenylalanine, tryptophan, and tyrosine were significantly increased in
dose-33
dependent manner. Leucine, isoleucine, and valine are branched amino acid which known to promote protein synthesis and turnover, signaling pathways and metabolism of glucose, and they are essential amino acids but in this experiment, branched amino acid was decreased while media retained a high level of branched amino acid (Fig. 2.5A, Fig 2.5B).
36
2.4.3.2. Changes of amino acid with polar uncharged side chains
Amino acids with polar uncharged side chain were threonine, serine, asparagine, and glutamine. HEK293 was transfected with the vehicle, 8μg, and 24μg of pCMV-Tag 2 synphilin-1 for 24 h into HEK293 and detected the amount of amino acid by GC-MS. Amino
acids with polar uncharged side chains increased with increasing synphilin-1 concentration. The uptake rate of polar uncharged amino acid was so slow in media, but these amount of amino acid was increased by synpillin-1in cells. These mean that this kind of amino acids was made by another metabolite like glutamic acid or related metabolites (Fig. 2.6A, Fig. 2.6B)
2.4.3.3. Changes of amino acid with electrically negative charged side chains
Amino acids with electrically negative charged side chain were aspartic acid and glutamic acid. HEK293 was transfected with the vehicle, 8μg, and 24μg of pCMV-Tag 2 synphilin-1 for 24 h into HEK293 and detected the amount of amino acid by GC-MS. Amino acids with
negatively charged side chains were increased with the synphilin-1 concentration in cells and media (Fig. 2.7A, Fig. 2.7B). The cells with synphilin-1 were needed glutamic acid and aspartic acid because of cellular metabolism and cell growth.
37
Figure 2.5A. Changes in amino acid with hydrophobic side chain in cells. The
amounts of the amino acid having hydrophobic side chain were detected by GC-MS.
38
amounts of the amino acid having hydrophobic side chain were detected by GC-MS.
Figure 2.6A. Changes in amino acid with polar uncharged side chain in cells.
The amounts of the amino acid having polar uncharged side chain were detected by GC-MS.
Figure 2. 6B. Changes in amino acid with polar uncharged side chain in media.
39
GC-MS.
2.4.3.4. Changes of amino acid with electrically positive charged side chains and special cases
Amino acids with electrically negative charged side chain and special cases were lysine, glycine, and proline. HEK293 was transfected with the vehicle, 8μg, and 24μg of pCMV-Tag 2 synphilin-1 for 24 h into HEK293 and detected the amount of amino acid by GC-MS. Glycine was not changed with increasing synphilin-1 concentration but lysine and proline were increased with synphilin-1. Especially proline was significantly increased like glutamine and glutamic acid while proline in media was decreased(Fig. 2.8A, Fig. 2.8B). High level of glutaminolysis related amino acid can influence to the high level of proline synthesized from glutamic acid via glutamate semialdehyde. Proline is a precursor for hydroxyproline for the body to make collagen, tendons, ligaments and heart muscle to help tissues withstand stretching and numerous epithelial cells make certain types of collagens.
40
Figure 2.7A. Changes in amino acid with electrically negative charged side chain in cells. The amounts of the amino acid having polar uncharged side chain were
detected by GC-MS.
Figure 2.7B. Changes in amino acid with electrically negative charged side chain in media. The amounts of the amino acid having polar uncharged side chain were
41
detected by GC-MS
Figure 2.8A. Changes in amino acid with electrically positive charged and special case in cells. The amounts of the amino acid having electrically positive and special
case side chain were detected by GC-MS.
Figure 2.8B. Changes in amino acid with electrically positive charged and special case in media. The amounts of the amino acid having electrically positive and special
42
2.4.4. Time-dependent expression of phosphorylated S6K1
To determine the starvation time, the confluent culture of HEK293 was washed
and incubated with Krebs-Ringer Bicarbonate Buffer containing glucose(4.5g/l) and
insulin (100nM). The cells were harvested after with starved for 30min, 1h, 2h, and
4h and the cells were restimulated with leucine and glutamine, which known to
increase the level of S6K1-pT389, for 15 min. The phosphorylation of S6K1-pT389
was increased from 30min and maintained after 24 h starvation and 15 min
restimulation with amino acids (Fig. 2.9). When the cells starved for time, cell body
was constricted and made an elongated branches around the cell.
Figure 2.9. Western blot with anti S6K1-pT389 after restimulation of
glutamine(Q)and leucine(L) and morphological changes. The protein lysates
were prepared after restimulation with glutamine and leucine and detected by
immunoblotting with anti S6K1-pT389 in HEK293.
43
2.4.5. Dose-dependent expression of S6K1-pT389 by amino acids.
To determine the changing dose of amino acids, the confluent culture of HEK293
was washed and incubated with Krebs-Ringer Bicarbonate Buffer containing
glucose(4.5g/l) and insulin (100nM). The cells were harvested after starving for 1h
and restimulated with 0.5, 1, 2, 4mM of glutamic acid, glutamine, proline, and
tryptophan. The tyrosine was treated with 0.125, 0.25, 0.5 and 1mM because of the
limit of solubility in aqueous solution. S6K1-pT389 was increased from 0.5mM of
glutamine and proline while glutamic acid was from 2mM. Tryptophan and tyrosine
were decreased from 0.5mM and 0.125mM (Fig. 2.10).
Figure 2.10. Western blot of anti S6K1-pT389 with amino acid
concentration. The Protein lysate was prepared at the starvation time and
44
2.4.6. Expression of S6K1-pT389 and Akt-pS473 in HEK293 and S293
The confluent culture of HEK293 and S293 cells were washed and incubated with Krebs-Ringer Bicarbonate Buffer containing glucose (4.5g/l) and insulin (100nM) for 24 h because of eliminating residual amino acid in cells. The cells were restimulated for 15 min and 60 min with 2mM of glutamine, glutamic acid, and proline which related the glutaminolysis pathway and harvested to examine the phosphorylation of mTOR signaling. The S6K1-pT389 was strongly increased in glutamine and glutamic acid treated cell and proline were increased after 60 min restimulation while S6K1 was unchanged. The expression of S6K1-pT389 was intensified with time.
The phosphorylation of Akt at Serine-473 was increased more in proline with restimulation time while glutamic acid and glutamine were weakly increased at 60min restimulation. The level of Akt was increased in glutamine and glutamic acid from 15 min with time (Fig. 2.11, 2.12). There are some differences between HEK293 and S293. Akt phosphorylation of S293 was higher than HEK293 while S6K1 phosphorylation of HEK293 was inversely higher than S293.
45
Figure 2.11. Amino acids induce phosphorylation of Akt-Ser473 and S6K1-Thr389 in HEK293. HEK293 cells were starved for 24 h and restimulated with 2mM of each
amino acid for 15 and 60 min. Western blot with an antibody (A) and relative expression pattern for 15min (B) and 60min (C) was calculated by Image J.
46
Figure 2.12. Amino acids induce phosphorylation of Akt-Ser473 and S6K1-Thr389 in S293. S293 cells were starved for 24 h and restimulated with 2mM of each amino
acid for 15 and 60 min. Western blot with an antibody (A) and relative expression pattern for 15min (B) and 60min (C) was calculated by Image J.
47
2.5. Discussions
To the best of our information, this study is the first to perform an amino acid profiling analysis in cells overexpressing synphilin-1 using GC-MS. Our results demonstrate that synphilin-1 overexpression induces the accumulation of glutamine, glutamic acid, proline, tryptophan, tyrosine, threonine, serine, aspartic acid, and lysine. Aliphatic hydrophobic amino acids including branched chain amino acid were decreased in the cell but the media was slightly increased. S293, HEK293 cells stably overexpressed with synphilin-1, has the different cell morphology and cellular response against HEK293 when starved with KRBB buffer. Furthermore, we found that overexpression of synphilin-1 modified the phosphorylation of S6K1 and Akt, mediators in Akt/PI3K/mTOR signaling pathway.
Glutamine has important in protein synthesis, regulation of acid-base balance in the kidney by producing ammonium, lipid synthesis, cellular energy synthesis of purine[60] carbon donation on TCA cycle, innocuous transporter of ammonia in the blood flow and precursor to the neurotransmitter glutamate and in maintaining the normal integrity of the intestinal mucosa[61]. Glutamine is the most copious amino acid in the blood and metabolized via glutaminolysis process. Glutaminolysis consists of both deamination steps. The first, glutamine converts to glutamate mediated by the enzyme glutaminase and the next deamination step was catalyzed by glutamate dehydrogenase, converts glutamic acid to
α-ketoglutarate as a principle intermediate in TCA cycle.
In this study, the amount of glutamic acid and proline were also significantly increased as glutamine. Glutamic acid is an important compound in cellular metabolism and synthesis including α-ketoglutarate in TCA cycle and plays an important role in the body’s disposal of extra or discarded nitrogen. It is the most plentiful excitatory neurotransmitter in the vertebrate nervous system [62]. Proline is biosynthetically derived from glutamate via glutamate-5 semialdehyde and cyclization to 1-pyrroline-5-carboxylic acid. The cyclic side
48
chain structure of proline gives proline an exceptional conformational rigidity than another amino acid. Proline induces alterations in gene expression, colony morphology, differentiation, and proliferation behavior of ES cells. The addition of 200μM L-proline induced colony morphology and the decrease of cell number while Oct4 gene expression was increased[15]. Also, proline acts as a signaling molecule promoting the conversion of embryonic stem cells into spindle-shaped, highly motile, invasive pluripotent stem cells via a genome-wide remodeling [63]. This result explained that the morphology change and cell aggregation in S293 are partially related to the different content of proline and accumulation of glutamate and glutamine. When each glutamine, glutamic acid, and proline were added HEK293 cell to conform, the phosphorylation of S6K1 and Akt was dose dependently increased. Even through tyrosine and tryptophan were increased, they did not influence the phosphorylation of S6K1 and Akt in this study.
The branched chain amino acids composed of leucine, valine, and isoleucine were decreased with overexpression of synphilin-1. They account for approximately 35% of the essential amino acids in muscle proteins required by mammals [64]. In this study, the reduced level of leucine, isoleucine, and valine may not influence the phosphorylation even though the leucine is an essential amino acid that directly binds and stimulates glutamate dehydrogenase [65] and brings to GTP loading of Rag and mTORC1 activation on lysosomal membrane.
Synphilin-1 is a major protein of Lewy body implicated in Parkinson’s disease pathogenesis and the mechanism is far from being completely elucidated. Recent studies have shown that the level of triglycerides and fat deposition was increased in synphilin-1 transgenic mice and flies, also glucose tolerance was impaired. In mouse obesity model, overexpression of synphilin-1 in neuron increases food consumption and body weight, suggesting that synphilin-1 relate to energy homeostasis[66, 67]. This cellular function of synphilin-1 in regulating ATP levels was reported and this may be essential roles in energy homeostasis and neuronal protection[67]. In this study, phosphorylation of Akt was
49
increased in S293 cells and this may influence the cell protection responding to starvation stress.
In conclusion, we found that overexpression of synphilin-1 altered all kinds of the amino acid level and especially increased the glutamine, glutamate, and proline influencing phosphorylation of S6K1 via mTORC1 activation, Synphilin-1 overexpression has influenced the phosphorylation of Akt and it was increased by proline via mTORC2. These results suggest that synphilin-1 may be contributing to changes in physiological metabolism via partially Akt/PI3K/mTOR pathway though the exact mechanisms do not know.
50
2.6. References
1. Pera, M.F. and P.P. Tam, Extrinsic regulation of pluripotent stem cells. Nature, 2010. 465(7299): p. 713-20.
2. Pittenger, M.F., et al., Multilineage potential of adult human mesenchymal stem cells. Science, 1999. 284(5411): p. 143-7.
3. Prockop, D.J., "Stemness" does not explain the repair of many tissues by mesenchymal stem/multipotent stromal cells (MSCs). Clin Pharmacol Ther, 2007. 82(3): p. 241-3. 4. Qian, L. and W.M. Saltzman, Improving the expansion and neuronal differentiation of
mesenchymal stem cells through culture surface modification. Biomaterials, 2004. 25(7-8): p. 1331-7.
5. Okolicsanyi, R.K., L.R. Griffiths, and L.M. Haupt, Mesenchymal stem cells, neural lineage potential, heparan sulfate proteoglycans and the matrix. Dev Biol, 2014. 388(1): p. 1-10. 6. Lee, C.M. and E.P. Reddy, The v-myc oncogene. Oncogene, 1999. 18(19): p. 2997-3003. 7. Belair, C.D., et al., Telomerase activity: a biomarker of cell proliferation, not malignant
transformation. Proc Natl Acad Sci U S A, 1997. 94(25): p. 13677-82.
8. Sugano, S. and N. Yamaguchi, Two classes of transformation-deficient, immortalization-positive simian virus 40 mutants constructed by making three-base insertions in the T antigen gene. J Virol, 1984. 52(3): p. 884-91.
9. Lee, H.J., et al., Brain transplantation of immortalized human neural stem cells promotes functional recovery in mouse intracerebral hemorrhage stroke model. Stem Cells, 2007.
25(5): p. 1204-12.
10. Marc Rhoads, J. and G. Wu, Glutamine, arginine, and leucine signaling in the intestine. Amino Acids, 2009. 37(1): p. 111-22.
11. Galli, F., Amino acid and protein modification by oxygen and nitrogen species. Amino Acids, 2012. 42(1): p. 1-4.
12. Paik, M.J., et al., Target metabolic profiling analysis of free amino acids in plasma as EOC/TBDMS derivatives by GC-SIM-MS. Biomed Chromatogr, 2008. 22(4): p. 339-42. 13. Kim, D.W., et al., Use of the human elongation factor 1 alpha promoter as a versatile and
51
efficient expression system. Gene, 1990. 91(2): p. 217-23.
14. Paik, M.J., J. Lee, and K.R. Kim, N-ethoxycarbonylation combined with (S)-1-phenylethylamidation for enantioseparation of amino acids by achiral gas chromatography and gas chromatography-mass spectrometry. J Chromatogr A, 2008. 1214(1-2): p. 151-6. 15. Washington, J.M., et al., L-Proline induces differentiation of ES cells: a novel role for an
amino acid in the regulation of pluripotent cells in culture. Am J Physiol Cell Physiol, 2010.
298(5): p. C982-92.
16. Nagai, A., et al., Multilineage potential of stable human mesenchymal stem cell line derived from fetal marrow. PLoS One, 2007. 2(12): p. e1272.
17. Tornheim, K. and J.M. Lowenstein, The purine nucleotide cycle. The production of ammonia from aspartate by extracts of rat skeletal muscle. J Biol Chem, 1972. 247(1): p. 162-9. 18. Croitoru-Lamoury, J., et al., Interferon-gamma regulates the proliferation and differentiation
of mesenchymal stem cells via activation of indoleamine 2,3 dioxygenase (IDO). PLoS One, 2011. 6(2): p. e14698.
19. May, T., H. Hauser, and D. Wirth, Transcriptional control of SV40 T-antigen expression allows a complete reversion of immortalization. Nucleic Acids Res, 2004. 32(18): p. 5529-38.
20. Wu, G., Amino acids: metabolism, functions, and nutrition. Amino Acids, 2009. 37(1): p. 1-17.
21. Forno, L.S., Neuropathology of Parkinson's disease. J Neuropathol Exp Neurol, 1996. 55(3): p. 259-72.
22. Thomas, B. and M.F. Beal, Parkinson's disease. Hum Mol Genet, 2007. 16 Spec No. 2: p. R183-94.
23. Lotharius, J. and P. Brundin, Pathogenesis of Parkinson's disease: dopamine, vesicles and alpha-synuclein. Nat Rev Neurosci, 2002. 3(12): p. 932-42.
24. Stoessl, J., Potential therapeutic targets for Parkinson's disease. Expert Opin Ther Targets, 2008. 12(4): p. 425-36.
25. Engelender, S., et al., Synphilin-1 associates with alpha-synuclein and promotes the formation of cytosolic inclusions. Nat Genet, 1999. 22(1): p. 110-4.
26. Szargel, R., R. Rott, and S. Engelender, Synphilin-1 isoforms in Parkinson's disease: regulation by phosphorylation and ubiquitylation. Cell Mol Life Sci, 2008. 65(1): p. 80-8. 27. O'Farrell, C., et al., Transfected synphilin-1 forms cytoplasmic inclusions in HEK293 cells.