Near-infrared Spectroscopy and an Example of HAM Study:
Brain Activation in the Development of Drawing Skills
Harumi Kobayashi* , Tetsuya Yasuda*, Satoshi Suzuki** , and Hiroki Takase***Graduate School, Social Informatics, Tokyo Denki University, Saitama, Japan , e-mail:h-koba@i.dendai.ac.jp
**The 21st Century COE Project Office, Tokyo Denki University (TDU), Tokyo, Japan,
e-mail:ssuzuki@ham.coe.dendai.ac. jp
Abstract: Near-infrared spectroscopy (NIRS) can be used to monitor brain activation by measuring changes in the concentration of oxy- and deoxy-hemoglobin (Hb) by their different spectra in the near-infrared range. Because NIRS is a noninvasive, highly flexible and portable device, it is very suitable to study brain activation when a human repeatedly performs a manipulative task, and possibly provides useful information to construct human adaptive mechatronics (HAM). There is some evidence that the dorsolateral prefrontal cortex (DLPFC) plays a major role in working memory and it is proposed that the use of working memory decreases as a human develops manipulative skills. In the present study, we investigated the activation of the dorsolateral prefrontal cortex (DLPFC) of the brain in Brodmann's areas 9 and 46 in drawing tasks to examine whether NIRS can measure the changes of DLPFC activation as a human develops manipulative skills. Subjects performed a mirror image drawing task and a square drawing task by ones’ left hands. In the mirror image task the subject drew following a star shape based on a mirror image of it, but square drawing did not involve mirror image and was estimated to be simpler. The changes of the concentration of oxy-Hb was higher in the mirror image drawing than the square drawing in most subjects. The changes of oxy-Hb decreased as the subject repeated the drawing task in most subjects. In conclusion, The activation of DLPFC measured by NIRS can reflect the brain activity in the development of manipulative skills.
Keyword: skill development, near-infrared spectroscopy, brain activation , working memory, dorsolateral prefrontal cortex
1. INTRODUCTION
Near-infrared spectroscopy (NIRS) can be used to monitor brain activation by measuring changes in the concentration of oxy- and deoxy-hemoglobin (Hb) by their different spectra in the near-infrared range. NIRS is a noninvasive method and has several advantages in comparison with other imaging methods, such as high flexibility, portability, and low cost.
It has been suggested that the frontal lobes are largely concerned with higher cognitive functions such as learning and performing complex tasks. There is some evidence that the dorsolateral prefrontal cortex (DLPFC) plays a major role in working memory[1]. It works to monitor the process of one’s conducting tasks and make programs to organize human behaviors spatially and temporally. DLPFC lies in Brodmann’s areas 46 and 9 of the frontal lobe. Bodmann’s area 46 is estimated to be important for human’s skilled performance. Therefore, we decided to investigate the activation of this area of the brain in a skilled performance.
As a task that needs skilled performance, we chose mirror image drawing by one’s left hand. It needs a subject to adapt mirrored images of a relatively complex pattern of a star and pay careful attention to coordinate visual information and the movement of a hand that is not used in usual drawing. The level of one’s skilled performance can be easily measured by number of errors and drown line length. Because right-handed participants are estimated to be unskilled about making coffee by one’s left hand, we expected that a developmental process can be more saliently observed if we look at consecutive making of ten cups of coffee by one’s left hand.
2. METHOD
2.1 Subjects
The subjects were seven male undergraduate and graduate students (age range 21-24), all right-handed with no history of neurological deficits. Written consent and ethical approval were obtained before the examination.
2.2 Probe Setting
International 10-20 System was used to decide the position of the probe of the optical light fibers on the scalp. International 10-20 System is a method of application of electrodes of EEG and based on the distance between the nasion and the inion of the scalp. The positions Fz was determined on the scalp of each subject and the a probe of 3 x 5 was attached on the scalp in such a way that Channel 16 is placed on Fz.
Fig.1 Positions of optical fiber channels.
ICCAS2005 June 2-5, KINTEX, Gyeonggi-Do, Korea
It was expected that the activation of Brodmann’s area 46 can be investigated by Channel 18 and 22 in the right hemisphere and Channel 14 and 19 in the left hemisphere. Changes in the concentration of oxy-, deoxy-Hb, and total Hb (sum of oxy- and deoxy-Hb) were measured by an ETG-4000 system (Hitachi Medical Corporation, Tokyo, Japan; two wavelengths 695nm, 830nm)
.2.3 Procedure
Subjects sat in a chair at a table with their eyelids closed, and did not receive any stimulation during rest time. In the first half of the experimental session, the subject perform
2.3.1 Mirror image drawing task
In the first half of the experimental session, the subject receied a mirror image drawing task. In this task the subject was able tto draw following a star shape based on a mirror image of the star shape. Fig. 2 shows the photograph of the mirror image drawing task, the star shape to be followed, and the view of the subject. In this task, the subject was not able to see the star shape directly. He was only allowed to look at the mirror image of the star shape during the drawing. The mirror image session consisted of 4 sets of 40 seconds of drawing task and 80 seconds of resting time. The first trial was an exercise trial. the subjects were expected to become familiar with the task. The results of the 2nd to 4th trials (Trial 1-3) were taken to analyze the development of task performance. Thus, the subject drew the same mirror image four times including the exercise trial.
2.3.2 Square drawing task
In the second half of the experimental session, the subject was asked to draw following a square shape. He was able to look at the shape directly without using mirror at all. Fig. 3 shows the photograph of the square drawing task, the square shape to be followed, and the view of the subject. The design of the time sequences of task and rest were exactly the same with the mirror image task. As behavioral measures, number of errors (erroneous drawings) and correctly followed line lengths were recorded.
Fig.3 Square drawing task.
The view of the subject
Fig.2 Mirror image drawing task.
The view of the subject
Fig.5 Photograph of the experiment
3. ANALYSIS
Time course analysis revealed that increase of oxy-Hb of two subjects was slow and possibly untypical. In these two subjects, the optimal oxy-Hb level increased as the subject repeated the task . Therefore, we decided that the data of the two subjects must be separately analyzed (“slow starters”) from remaining five subjects (“non-slow starters,” seemingly typical).
3.1 Analysis of NIRS data
Because left hand movement is mainly associated with activation of the right hemisphere, peaks of oxy-Hb obtained before and after 50 sec of the beginning of each trial at Channel 18 and 22 in the right hemisphere were determined . A time interval between 5 sec before and after the time point of the peak of Channel 18 was determined, and a mean change of concentration of oxy-Hb was calculated for this channel in this interval. A mean concentration change of oxy-Hb was also calculated for Channel 22. As for the activation of the left hemisphere, we calculated the means of concentration of oxy-Hb for Channel 14 based on the same time point with Channel 18 and Channel 19 based on the same time point with Channel 22. A mean concentration change of oxy-Hb was calculated for Channel 22 and 18 in a similar manners with Channel 18 and 22.
Exe. Trial 1
time
1 301 601 901 1201 1501 1801 2101 2401 2701 3001 3301 3601 3901 4201 4501 4801 5101
CH14 CH18 CH19 CH22
Fig.6 Time course data of a subject
Fig.7 Mean Change of oxy-Hb concentration at Channel 18 (R) and 14 (L) among non-slow starters (n=5)
Fig.8 Mean Change of oxy-Hb concentration at Channel 22 (R) and 19 (L) among non-slow starters (n=5)
Fig.9 Mean Change of oxy-Hb concentration at Channel 18 (R) and 14 (L) among slow starters (n=2)
Fig.10 Mean Change of oxy-Hb concentration at Channel 19 and 22 among slow starters (n=2)
Trial 2 Trial 3
3. 2 Analysis of Performance Data
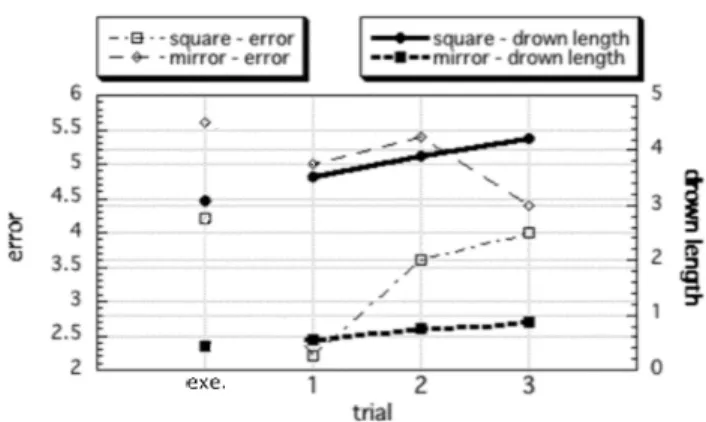
As behavioral measures, number of errors (erroneous drawings) and correctly followed line lengths were recorded.Fig.11 and 12 show the frequency of errors in the mirror image drawing task and the square drawing task. The number of errors decreased in the mirror image drawing, whereas it did not clearly decrease in the square drawing task. The drawn length decreased in the both tasks. Overall, the subjects developed drawing skills in the three trials
4. RESULTS AND DISCUSSION
Fig. 7 shows the mean change of oxy-Hb concentration at Channel 18 of the right hemisphere and Channel 14 of the left hemisphere in the mirror image drawing task and the square image drawing task among non-slow starters (or possibly typical type). The results : (1) Activation of Channel 14 and 18 decreased as the subject repeated the experimental task. (2) Activation of Channel 18 was higher than Channel 14. (3) Brain activation was higher in the mirror image drawing task than the square drawing task. Fig. 8 shows the mean change of oxy-Hb concentration at Channel 19 and 22 among non-slow starters. Basically the same result with Channel 14 and 18 of non-slow starters was obtained. Fig. 9 shows the mean change of oxy-Hb concentration at Channel 18 and Channel 14 in the mirror image drawing task and the square image drawing task among slow starters (or possibly untypical type).
The results : (1) In the mirror image drawing task, unlike the result of non-slow starters, slow starters’ activation of Channel 14 and 18 increased as the subject repeated the experimental task. However, in the square drawing task, activation of these channels decreased. (2) In the mirror image drawing task, unlike non-slow starters, slow starters’ activation of Channel 18 was lower than Channel 14. However, in the square drawing task, the same pattern with non-slow starters was obtained. (3) Like non-slow starters, slow starters’ brain activation was higher in the mirror image drawing task than the square drawing task. (4) High level brain activation was obtained in the left hemispheres (Channel 14 and 19) in the mirror image drawing but not in the square drawing among the slow starters (Fig.10).
As a result, the measurement of concentration change of oxy-Hb was able to reflect the human’s performance in easy and difficult tasks, skill development in those tasks, and in addition, individual differences in skill development. It was suggested that NIRS can be a useful tool to measure human’s skill development.
Conclusion
We presented that the activity of dorsolateral prefrontal ccotdecreased as a subject repeated a task. It was suggested that measuring activation of DLPFC by NIRS reflected the brain activity in the development of a human’s manipulative skills.. NIRS is a potential source of information to examine the development of manipulative skills.
REFERENCES
[1] Yoko Hoshi, Ichiro Oda, Yukihisa Wada, Yasunobu Ito,
Yutaka Yamashita, Motoki Oda, Kazuyoshi Ohta, Yoshifumi Yamada, Mamoru Tamura, Visuospatial imagery is a fruitful strategy for the digit span backward task: a study with near-infrared optical tomography, Cognitive Brain Research 9(3) (2000) pp. 339-342.
Fig.11 Errors and drown length of Non-slow starters’ performance in mirror image drawing task and square drawing task (n=5)
*Note: The whole length of the shape as 1.0
Fig.12 Errors and drown length of Slow starters’ performance in mirror image drawing task and square drawing task (n=2)
*Note: The whole length of the shape as 1.0