Velocity of Delayed Hydride Cracking with Stress Intensity Factor
in Zr-2.5Nb Pressure Tube
Kang Soo Kim, Young Suk Kim, Yong Moo Cheong, Sang Bok Ahn, Kyoung Soo Im
Korea Atomic Energy Research Institut, 150, Dukjin-dong, Daejeon 305-353, Korea, kskim5@kaeri.re.kr 1. Introduction
Delayed Hydride Cracking (DHC) has led many Zr-2.5Nb pressure tubes to be replaced or fail during their operation in heavy water reactors. DHC was known to occur by diffusion of hydrogen to a crack tip, nucleation and growth of hydrides followed by fracturing of hydrides. Since some incidents of tube failures by DHC in 1970s, lots of researches have been conducted to understand its mechanism. Dutton and Puls suggested that a driving force for DHC is the tensile stress gradient formed at the crack tip [1]. However, this model can’t explain the unique phenomenon of DHC or the constant crack growth rate independent of the applied stress intensity factor or K, as shown in Fig.1, Fig. 2 and Fig. 3. The DHC crack starts to grow only if the applied K exceeds the threshold stress intensity factor (or KIH) and its velocity
increases quickly, which is termed Stage I. At Stage II, the DHC velocity becomes constant with an increase in the applied K. Besides, the spacing of striation lines on the fractured surfaces after DHC tests is wider close to the notch, becomes smaller gradually with increasing K and levels off to a constant at Stage II. [2]. The aim of this paper is to explain the cause for a change of the DHC velocity with increasing K based on the analysis of the stress state at the crack tip using a finite element method (FEM).
Fig. 1. Dependence of the crack growth velocity with K.
Fig. 2 Striation lines on the fractured surfaces of DHC CT specimen
Fig. 3. Variation of the striation spacing of DHC.
2. Methods and Results
Using FEM, the elements near the crack tip are modeled and compared with the previous experimental data [3]. Also, the plastic zone size near the crack tip is calculated for checking the effects of the plastic constraint and notch strengthening
.
2.1 Materials and Specimen
The material used is a cold-worked Zr-2.5Nb pressure tube and its room temperature mechanical properties are represented in Table 1. The detail dimension of CT specimen(thickness=4.2 mm) is shown in Fig. 4.
Table 1 Mechanical properties of the Zr-2.5Nb alloy used in finite element analysis
Elastic Modulus (MPa) Poisson’s Ratio Yield Strength (MPa) 102000 0.38 869 21.250 20.400 17.000 6.800 R2.125 5.520 9.450
Fig. 4. Dimension of compact tension specimen.
2.2 FEM Model
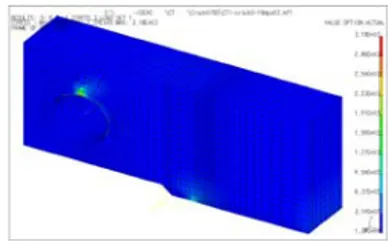
IDEAS code for FEM analysis and 10240 elements of solid linear brick is used. 3D FEM model is shown in Fig. 5. and includes pre-fatigue crack length of 1.7 mm. The element length near crack tip is 130 µm of the maximum length which the hydride is able to grow at Stage I[2].
Fig. 5. 3D Finite Element Modeling of CT specimen. Transactions of the Korean Nuclear Society Autumn Meeting
2.3 Hydride behavior at Crack Tip
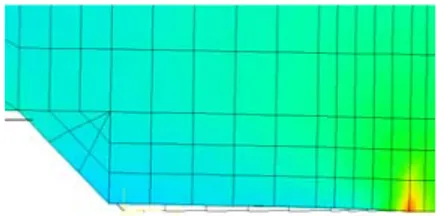
The stress and displacement at elements near a crack tip is examined in increasing load (K). The elements near a crack tip are moved in the direction of –X as shown in Fig. 6. Also, the tensile force in the direction of –X and +Y is acted at that. This means that the tensile force restrains the hydride growth in the direction of +X and promotes the hydride growth in the direction of +Y. Up to now, Puls and Scarth had considered the stress in the direction of Y(σy). But,
actually, σx is not small value in comparing with σy.
Table 2 represents the stress level of a crack tip element according to each K value. When σx is the small value,
the hydride grows in the direction of +X. If σx attains
some value, the growth of the hydride length stops and hydride grows in the direction of +Y of the thickness direction of hydride. Thus, the maximum length of the hydride growth is to be 127 µm at Stage I[2]. σx value
is gradually large in increasing load and the growth of hydride length is restrained. Thus, the striation spacing is gradually narrow. Finally, when σx becomes 725
MPa (K=10MP m), the length growth of hydride stops
and the hydride grows in the direction of the thickness (Y direction) at stage II as shown in Fig. 2, Fig. 3 and table 2. Thus, spacings of striation lines become constant.
Fig. 6. Behavior of the elements near the crack tip.
Table 2 Stress level of the crack tip element according to each K value. K 5 6 8 10 12 14 16 x σ (MPa) 363 435 580 725 870 1015 1164 y σ (MPa) 571 685 913 1142 1370 1598 1832
When K value increases, the experimental data of which the hydride length is gradually large, become constant and the hydride thickness increase at some value ( K=9.7 MPa m), is represented in table 3. Table 3 Hydride thickness and length according to each K value.
K Hyd. Thickness(mm) Hyd. Length(mm)
3.5 0 0
8.65 2 23.5
9.2 2 53.0
9.7 4.5 103.0
11.1 8.75 102.0
2.4 Size of Plastic Zone at Crack Tip
The size of the plastic zone at the crack tip according to each K value is represented in Table 4. The crack length in each K value is reflected in calculating the size of the plastic zone. As shown in Table 4, the size of the plastic zone is in proportion to K value. This means that the energy of the load (K) increased is spent in increasing the plastic zone. Thus, DHC velocity is constant at Stage II even if K value increase. The more the size of plastic zone is increasing, the more the force of the plastic restraint is increasing. This means that the compression force increased near the crack tip restrains the growth of the hydride. Also, the effect of the notch strengthen (the more the crack length is increasing, the more the fracture toughness is increasing) assists to explain the fact that DHCV is constant at Stage II even if the K value increase.
Table 4 Plastic zone size according to each K value
K Crack Length(mm) Plastic Zone(mm)
16 0.765 0.85
20 1.015 1.33
24 1.310 1.84
3. Conclusion
When σx is the small value, the hydride grows in the
direction of +X. If σx attains some value, the growth of
the hydride length stops and hydride grows in the direction of +Y of the thickness direction of hydride. Thus, spacings of striation lines become constant at Stage II. the size of the plastic zone is in proportion to K value. This means that the energy of the load (K) increased is spent in increasing the plastic zone. Also, the plastic restraints and the effect of the notch strengthen assist to explain the fact that DHCV is constant at Stage II even if the K value increase.
Acknowledgements
This project has been carried out under the nuclear R & D program by the Ministry of Science and Technology.
REFERENCES
[1] M. P. Puls, L. A. Simpson and R. Dutton, In Fracture Problems and Solution in the Energy Industry, L. A. Simpson, Ed., Pergamon Press, Oxford, 1982, pp.13-25.
[2] Choi S. J., Ahn S B., Park S. S. and Kim Y. S., A Correlation of Striation Spacing and DHC Velocity in Zr-2.5 Nb Tubes, Transactions of KSME, A, Vol. 28, No 8, pp. 1109-1115.
[3] Gordon K. Shek, Jun Cui, and Vuko Perovic., Overload Fracture of Flaw Tip Hydrides in Zr-2.5Nb Pressure Tubes,
Zirconium in the Nuclear Industry: 14th. International