A Physiologically Based Pharmacokinetic Model for Absorption and
Distribution of Imatinib in Human Body
Mohammad Mahfuz Chowdhury,† Do Hyun Kim,†,* and Jeong Keun Ahn*
Department of Microbiology, Chungnam National University, Daejeon 305-340, Korea. *E-mail: jkahn@cnu.ac.kr †Department of Chemical and Biomolecular Engineering, KAIST, Daejeon 305-701, Korea. *E-mail: dohyun.kim@kaist.ac.kr
Received August 27, 2011, Accepted September 13, 2011
A whole body physiologically based pharmacokinetic (PBPK) model was applied to investigate absorption, distribution, and physiologic variations on pharmacokinetics of imatinib in human body. Previously published pharmacokinetic data of the drug after intravenous (i.v.) infusion and oral administration were simulated by the PBPK model. Oral dose absorption kinetics were analyzed by adopting a compartmental absorption and transit model in gut section. Tissue/plasma partition coefficients of drug after i.v. infusion were also used for oral administration. Sensitivity analysis of the PBPK model was carried out by taking parameters that were commonly subject to variation in human. Drug concentration in adipose tissue was found to be higher than those in other tissues, suggesting that adipose tissue plays a role as a storage tissue for the drug. Variations of metabolism in liver, body weight, and blood/plasma partition coefficient were found to be important factors affecting the plasma concentration profile of drug in human body.
Key Words : Physiologically based pharmacokinetic model, Imatinib, Compartmental absorption and transit model, Plasma concentration profile
Introduction
Imatinib (Glivec) is a tyrosin kinase inhibitor regulating signal transduction and is approved for the treatment of chronic myeloid leukemia (CML) and gastrointestinal stromal tumor.1 The molecular formula of imatinib is C29H31N7O and its molecular weight is 493.6 (Fig. 1). The
mean fraction of imatinib in plasma was found to be 70% in healthy humans and up to 92% in acute lymphatic leukemia (AML) patients.2 The drug highly binds to human plasma proteins, mainly albumin and α1-acid glycoprotein (AGP).1
The unbound fraction of imatinib in plasma of healthy humans and AML patients was in a range of 2.3-6.5% at concentration ≤ 5000 ng mL−1.2 Imatinib is a substrate of P-glycoprotein (P-gp) and cytochrome P450 3A4 (CYP3A4).3
The pharmacokinetics of imatinib was extensively investi-gated in healthy humans and CML patients. Plasma con-centrations of orally administered imatinib as capsule or oral solution, compared with intravenous infusion, were measur-ed in healthy humans.4 In another study, bioequivalence, safety, and tolerability of imatinib tablets compared with capsules were investigated in healthy humans.5 Those studies reported the intersubject variability of imatinib
pharmaco-kinetics and attributed this variation to the differences in binding of imatinib to plasma proteins or to various physio-logical properties of CYP3A4. However, the cause of inter-subject variation was not clear.
In the human small intestine, CYP3A4 is localized to the columnar epithelial cells lining the intestinal lumen and P-gp is found on the apical surface of these cells. It has been reported that CYP3A4 and P-gp may act synergistically in the small intestine to limit oral drug bioavailability.3 Imatinib is also metabolized in the liver, mainly by CYP3A4 and CYP3A5 isoenzyme system. Variations of physiologic factors such as CYP isoenzyme activities in the liver, CYP3A4 and P-gp activities in the small intestine, mean fraction of imatinib in plasma, plasma protein bindings, and body weight can be responsible for the intersubject variation of imatinib pharmacokinetics. A whole body physiologically based pharmacokinetic (PBPK) model gives a mechanistic basis to analyze the effects of various physiologic factors on imatinib pharmacokinetics. A whole body PBPK model has an advantage of providing realistic description of human but it needs a lot of input parameters. Some parameter values may not be obtained due to the paucity of experimental data. Hence, whenever distinct kinetic data are available, PBPK models can be used to estimate kinetic constants. Sensitivity analysis can be used as an aid in identifying the important uncertainties in the model and has been applied in various fields including complex engineering systems, social sci-ences, medical decision making, and others.6 Therefore, sensitivity analysis of the whole body PBPK model can be used to identify the important physiologic factors.
The purposes of this study are to construct the whole body PBPK model to determine absorption and distribution of
imatinib by simulating published data with optimized pharmacokinetic constants and partially by using an existing compartmental absorption and transit (CAT) model structure for gastrointestinal track (GI) and to identify important physiologic factors affecting imatinib pharmacokinetics by sensitivity analysis of the whole body PBPK model.
Experimental Methods
Construction of the Whole Body PBPK Model. The whole body PBPK model included the following organs and tissues as its compartments: lung, adipose, bone, brain, heart, kidney, muscle, spleen, GI, liver, skin, and arterial and venous blood (Fig. 2). Mass transfer of drug between blood and other minor tissues such as bronchial tissue, thyroid, lymph nodes, and gonads was considered negligible. So mass carried by total arterial blood flow through these minor tissues was directly added to venous blood compartment. Imatinib is a highly soluble and highly permeable drug.1 Hence, the following assumptions were held to be true: its mass transfer between blood and tissues was considered as blood flow was limited; equilibrium partitioning of drug occurred between arterial blood and tissue; drug distribution in tissue was homogenous. The following description of the mathematical equations used in the model reveals all other assumptions embedded in the overall model.
The symbols used in the equations refer to blood flow (Q), concentration (C), mass (M), volume (V), tissue:plasma partition coefficient of drug (Pt:p), blood:plasma ratio of drug
(B:P), and derivative with respect to time operator (d/dt). The subscripts refer to tissue (t), hepatic/liver (h), GI (g), spleen (sl), lung (l), cardiac output (c), arterial blood (ab),
mixed venous blood (vb), venous blood leaving tissue (vbt), and mixed venous plasma (vp).
Imatinib and its metabolites are not significantly excreted by the kidneys.1 So except the liver, lung, GI, and blood compartments, the mass balance equations for all tissues are as follows.
The following equation is the expression for the drug concentration in venous blood leaving tissue and is same for all tissues.
Imatinib is usually an orally administered drug. Oral dose is introduced in the stomach and absorbed in the portal vein blood as drug goes through the GI. A study had developed a compartmental absorption and transit (CAT) model to account the absorption process.7 In that model, metabolism and efflux of imatinib in GI by CYP3A4 and P-gp were modeled using Michaelis-Menten type kinetics. Mass balance equation for the GI is as follows.
where Mepi is the drug mass in the epithelial cells of GI and
kabs is the absorption rate constant.
Mass balance equation in the liver is:
where Vmax,h is the maximum velocity of flux in the liver,
Km,h is the Michaelis-Menten constant which is the
concentration at which half-maximal velocity of flux in the liver, Qbile is the bile flow rate, and Qh represent the total
arterial blood flow through the liver, gut, and spleen. For the lung, the mass balance equation is:
Arterial blood compartment mass balance equation is:
Mass balance equation for venous blood compartment is:
where Qothers is total blood flow rate through all minor
tissues.
So the plasma concentration of drug is: VtdCt dt --- = Qt(Cab–Cvbt) Cvbt = Ct Pt:p/B:P ( ) ---VgdCg dt --- = Qg(Cab–Cvbt) k+ abs×Mepi VhdCh dt --- = Q( h–Qg–Qs1) C× ab+ Q( g×Cvbg+Qs1×Cvbs1–Qh×Cvbh) −Vmax,h×Ch Km,h+Ch ---−Qbile×Ch V1dC1 dt --- = Qc(Cvb–Cvbl) VabdCab dt --- = Qc(Cvb1–Cab) VvbdCvb dt ---=Qothers×Cab+(ΣQt(Cab–Cvbt))−Qc×Cvb Cvp=Cvb/B:P
Figure 2. Schematic representation of the whole body PBPK model of human for imatinib.
The whole body PBPK model was also easily modified to simulate i.v. infusion data, which was necessary for parameter optimization as described in ‘Model Parameters’ section. The modifications were followings: kabs value was
set to zero and constant infusion rate over certain time was added in venous blood compartment; instead of using Vmax,h
and Km,h, the liver extraction ratio Eh, which is the fraction of
metabolized drug mass in the liver, was used as it can be obtained from plasma clearance of imatinib.
Model Parameters. Plasma concentrations of i.v. infusion were measured from one human subject group of which average body weight was 73.3 kg.4 Plasma concentrations of tablet form oral dosing were measured from another human subject group of which average body weight was 75.52 kg.5 Cardiac output (Qc) was calculated by using allometric
scaling law as follows,
Qc = 0.235 × (Bw)0.75
where Bw is the body weight. Blood flows through tissues
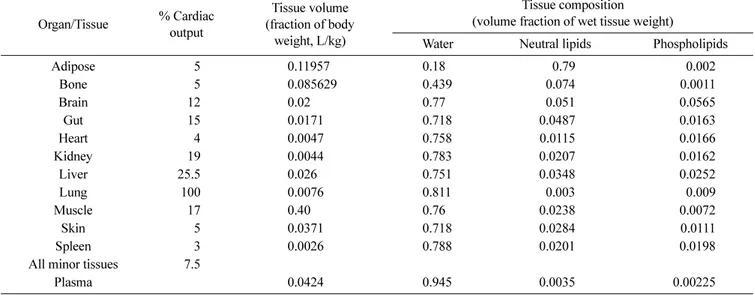
are given as percentages of the cardiac output in Table 1.8 Tissue volumes and composition were obtained from a study which estimated these values from literatures9 and were also shown in Table 1. Arterial and venous blood volumes were taken as 25.71 mL/kg and 51.43 mL/kg of body weight.10 B:P value was taken equal to 100/70 or 1.43. Pt:ps for non
adipose tissues were calculated from n-octanol/water parti-tion coefficient (Po:w) according to previously published
mechanistic equation.11 Pt:p for adipose tissue could be
calculated from vegetable oil/water partition coefficient (D*vo:w) for ionizable chemical using another mechanistic
equation.12 In absence of experimental value of D*vo:w, Pt:p
for adipose tissue was derived by fitting model output with the experimentally measured plasma concentrations for i.v. infusion at constant rate. Eh was calculated from the reported
drug plasma clearance (CLplasma) in the case of i.v. infusion
according to following equation,
where LBF is liver blood flow.
All the parameter values used in the CAT model adopted in GI was taken from previously reported study.7
Simulation Software and Sensitivity Analysis Tool. The model was constructed and simulated using Jacobian Model-ing Language release 1.00 (Numerica Technology, Inc). Parameter optimization procedure by minimizing weighted least square or maximum likelihood objective function can be incorporated in the modeling language. In this study, maximum likelihood objective function was minimized for parameter optimization. It also contains functions to carry out automatic differentiation for sensitivity analysis. Partial derivatives of the variables with respect to model parameters are measures of local sensitivity. Absolute time integral of the local sensitivity trajectory at one value of a parameter can be calculated. So for several values of a parameter chosen randomly from that parameter space, summation of those local sensitivities gives global sensitivity of the para-meter. Global sensitivities of all parameters can be averaged and relative global sensitivity, which is the ratio of global sensitivity of a parameter to the average global sensitivity, can be used for choosing important parameters.
Results and Discussions
Experimental value for D*vo:w to use as an input parameter
in the mechanistic equation to calculate Pt:p of adipose tissue
was not reported yet. So Pt:p of adipose tissue was optimized
by fitting model output with the experimentally measured plasma concentrations for 100 mg i.v. dose of imatinib infused at constant rate over one hour. The optimized Pt:p
value was determined to be 22.0867 and it was in the report-ed range of adipose tissue Pt:p values for high lipophilic drug
that is from ~0.05 to 130.12 Imatinib has limited penetration across blood-brain barrier and the concentration of imatinib
Eh=CLPlasma
LBF --- 1
B:P
---Table 1. Physiologic parameters for human Organ/Tissue % Cardiac output Tissue volume (fraction of body weight, L/kg) Tissue composition (volume fraction of wet tissue weight)
Water Neutral lipids Phospholipids
Adipose 5 0.11957 0.18 0.79 0.002 Bone 5 0.085629 0.439 0.074 0.0011 Brain 12 0.02 0.77 0.051 0.0565 Gut 15 0.0171 0.718 0.0487 0.0163 Heart 4 0.0047 0.758 0.0115 0.0166 Kidney 19 0.0044 0.783 0.0207 0.0162 Liver 25.5 0.026 0.751 0.0348 0.0252 Lung 100 0.0076 0.811 0.003 0.009 Muscle 17 0.40 0.76 0.0238 0.0072 Skin 5 0.0371 0.718 0.0284 0.0111 Spleen 3 0.0026 0.788 0.0201 0.0198
All minor tissues 7.5
in the cerebrospinal fluid of a patient was found to be 100-fold lower than that in plasma.1 Using the brain Pt:p value
obtained from the mechanistic equation, imatinib concent-rations in brain were found much higher than those in plasma. Therefore the brain Pt:p value was first roughly
calculated by assuming that the ratio of drug concentration between venous blood emerging from brain and brain tissue was to be 100 and by dividing B:P by 100. Then, that resulting value (0.0143) was adjusted to 0.01 to make brain concentration 100 times lower than plasma concentration. Final concentration profile of imatinib in plasma from the model compared with experimental data and the concent-ration profile in brain are shown in Figure 3 and Figure 4 respectively. The concentration profiles in other organs and tissues are shown in Figure 5.
The optimized Pt:p values of adipose tissue and brain in i.v.
infusion simulation and the Pt:p values of other tissues
calculated from the mechanistic equation were used in oral administration simulation. The absorption rate constant value of 0.001902 s−1 reported in the previous CAT model study for imatinib did not fit the simulation data with experimental data of plasma concentration well. So, along Michaelis-Menten constant for liver metabolism, the absorp-tion rate constant was also estimated by fitting simulaabsorp-tion output with experimental plasma concentration data. The
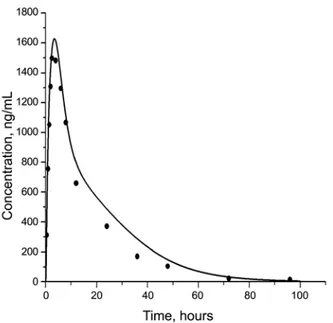
Figure 3. Predicted plasma concentrations (solid lines) compared with experimental plasma concentrations (circles) after i.v. infusion of imatinib.
Figure 4. Predicted concentration in brain after i.v. infusion of imatinib (linear scale).
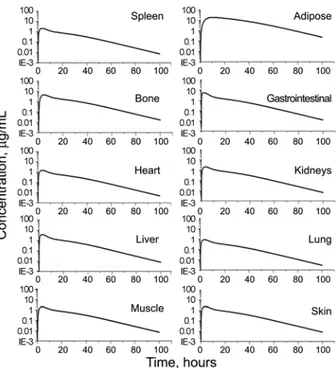
Figure 5. Predicted concentration profiles in various organs and tissues after i.v. infusion of imatinib (log scale).
Figure 6. Predicted plasma concentrations (solid lines) compared with experimental plasma concentrations (circles) after oral admini-stration of imatinib.
values of Vmax,h, Km,h, and kabs were obtained as 0.002234
mg/s, 0.000373 mg/mL, and 0.000167 s−1 respectively. Drug concentration profiles in plasma compared with experi-mental data and those in brain are shown in Figure 6 and Figure 7 respectively. Concentration profiles in other organs and tissues are shown in Figure 8.
After obtaining all parameter values, sensitivity analysis of the whole body PBPK model for oral administration was carried out to find out important physiologic factors which affect plasma concentrations profile. Sensitivity of plasma concentration was analyzed with respect to several physio-logic factors including body weight (BW), unbound fraction
of drug in plasma ( fup), B:P, activity of P-gp in GI (Veffmax),
activity of CYP3A4 in GI (Vmetmax), absorption rate constant
(kabs), and activity of CYP3A4 in liver (Vmax,h). For the
random selection of the factor values, probable value ranges were defined using lower and upper limits of each factor value. Lower and upper limits of body weight were 60 kg and 80 kg respectively. Lower and upper limits of fup and
B:P were set according to their variation in healthy humans and patients. Lower and upper limits of Veffmax, Vmetmax, and
Vmax,h were taken ten times lower or higher than nominal
values of these factors respectively. Absorption rate constant for human ranges from ~1.67 × 10⁻⁴ s−1 to 1.167 × 10⁻² s−1 and this range was used for the factor value. Relative global sensitivity of the physiologic factors is shown in Figure 9.
In this study, the drug concentration in adipose tissue was found to be much higher than those in other tissues after both i.v. infusion (Fig. 5) and oral administration (Fig. 8). Adipose tissue acts as a storage tissue for the drug imatinib. The terminal elimination half-life of imatinib in plasma ranges from 10 hours to 18.9 hours.1 High concentration of imatinib in adipose tissue can explain the quite long half-life of imatinib.
Relative global sensitivities of BW, B:P, and Vmax,h were
found to be greater than 1 (Fig. 9). So these factors will have important effects on plasma concentration profile which is the disposition of imatinib in human body. Body weight was used to calculate tissue volumes from their fractions of body weight and cardiac output by allometric equation. Hence, good sensitivity of plasma concentration profile on body weight variation was natural outcome. Variation in unbound drug fraction in plasma or drug binding plasma proteins did not have much influence on plasma concentration profile in
Figure 7. Predicted concentration in brain after oral administration of imatinib (linear scale).
Figure 8. Predicted concentration profiles in various organs and tissues after oral administration of imatinib (log scale).
Figure 9. Relative global effects of physiologic factors on the plasma concentration profile in the whole body PBPK model for oral administration.
this study. Contrastingly it has been reported that imatinib resistance might be due to drug binding plasma proteins, mainly AGP.1 Actually, some in vivo and in vitro studies reported the possible imatinib resistance due to its binding proteins but others didn’t find any correlation between imatinib resistance and its binding proteins. In addition, plasma concentration profile was found to be sensitive on B:P, the blood/plasma partition coefficient.
Variation in activities of P-gp and CYP3A4 in GI exhibit-ed negligible sensitivity on plasma concentration profile, though CYP3A4 had large influence over plasma concent-ration compared to P-gp. Passive permeability of the highly soluble and highly permeable drug imatinib overrules the effect of P-gp mediated efflux of drug in GI lumen.13 Although CYP3A4 activity in GI was varied up to ten times of the nominal value, it had a minimal effect on the pharmacokinetics demonstrating its negligible contribution in the first pass metabolism of the drug. Absorption rate constant variation among humans also does not have much sensitivity on plasma concentration profile. Variation in liver metabolism activity has the highest relative global sensi-tivity, of which value is much higher than those of other factors. Supported by this finding and the fact that variation of CYP isoenzyme activity in liver among individuals is large, it is concluded that liver metabolism has the most profound effect on plasma concentration profile and is the main factor responsible for intersubject variability of imatinib pharmacokinetics.
Conclusion
The analysis of whole body PBPK model of imatinib elucidated that the drug concentration in adipose tissue was much higher than those in other tissues, suggesting that
adipose tissue acts as a storage tissue for the drug. Body weight and blood/plasma partition coefficient are important physiological factors affecting the plasma concentration profile and the metabolic activity of liver is the most important key factor determining the disposition of imatinib in human body
Acknowledgments. This study was supported by a grant of the Korea Healthcare Technology R&D Project, Ministry of Health &Welfare, Republic of Korea (A084663). M. M. Chowdhury was financially supported by Korea Research Foundation through the Foreign Student-Researcher Invita-tion Program.
References
1. Peng, B.; Lloyd, P.; Scharn, H. Clin. Pharmacokinet. 2005, 44, 879.
2. Kretz, O.; Weiss, H. M.; Schumacher, M. M.; Gross, G. Br. J. Clin. Pharmcol. 2004, 58, 212.
3. Kivistö, K.; Niemi, M.; Fromm, M. F. Fund. Clin. Pharmacol. 2004, 18, 621.
4. Peng, B.; Duterix, C.; Mehring, G.; Hayes, M. J.; Ben-Am, M.; Seiberling, M.; Pokorny, R.; Capdeville, R.; Lloyd, P. J. Clin. Pharmacol. 2004, 44, 158.
5. Nikolova, Z.; Peng, B.; Hubert, M.; Seiberling, M.; Keller, U.; Ho, Y.; Schran, H.; Capdeville, R. Cancer Chemother. Pharmacol. 2004, 53, 433.
6. Frey, H. C.; Patil, S. R. Risk Anal. 2002, 22, 553.
7. Kwon, H.; Lionberger, R. A.; Yu, L. X. Mol. Pharm. 2004, 1, 455. 8. Valentine, J. ICRP. Pub. 2003, 89, 140.
9. Poulin, P.; Theil, F. P. J. Pharm. Sci. 2002, 91, 129.
10. Igari, Y.; Sugiyama, Y.; Sawada, Y.; Iga, T.; Hanano, M. J. Pharmacokinet. Biopharm. 1983, 11, 577.
11. Poulin, P.; Theil, F. P. J. Pharm. Sci. 2000, 89, 16.
12. Poulin, P.; Kerstin, S.; Theil, F. P. J. Pharm. Sci. 2001, 90, 436. 13. Varma, M. V. S.; Sateesh, K.; Panchagnula, R. Mol. Pharm. 20.