Photoemission and x-ray absorption of the electronic structure of multiferroic RMnO
3„R=Y,Er…
J.-S. Kang,1,2,*S. W. Han,2J.-G. Park,2,3S. C. Wi,1S. S. Lee,1G. Kim,1H. J. Song,4H. J. Shin,4W. Jo,5 andB. I. Min6
1Department of Physics, The Catholic University of Korea, Puchon 420-743, Korea 2CSCMR, Seoul National University, Seoul 151-742, Korea
3Department of Physics, Sungkyunkwan University, Suwon 440-746, Korea 4Pohang Accelerator Laboratory (PAL), POSTECH, Pohang 790-784, Korea
5Department of Physics, Ewha Womans University, Seoul 120-750, Korea 6Department of Physics, POSTECH, Pohang 790-784, Korea
共Received 17 November 2004; revised manuscript received 18 January 2005; published 30 March 2005兲
Electronic structures of multiferroic RMnO3共R=Y,Er兲 have been investigated by employing photoemission
spectroscopy共PES兲 and x-ray absorption spectroscopy 共XAS兲. We have found that Mn ions in RMnO3are in
the trivalent high-spin state with the total spin of S = 2. The occupied Mn共dxz− dyz兲 states lie deep below EF,
while the occupied Mn共dxy− dx2−y2兲 states overlap very much with the O 2p states. It is observed that the PES
spectral intensity of Mn 3d states is negligible above the occupied O 2p bands, suggesting that YMnO3is
likely to be a charge-transfer insulator. The Mn d3z2−r2state is mostly unoccupied in the ferroelectric phase of
YMnO3.
DOI: 10.1103/PhysRevB.71.092405 PACS number共s兲: 77.84.⫺s, 79.60.⫺i, 71.20.Eh
Hexagonal yttrium共Y兲 and rare-earth 共R兲 manganites of the formula RMnO3共R=Ho, Er, Tm, Yb, Lu, or Y兲 belong to an interesting class, known as multiferroic materials, in which the ferroelectric and magnetic ordering coexist at low temperatures.1–4 Hexagonal RMnO
3 compounds have anti-ferromagnetic ordering with the Neel temperature 共TN兲 of TN⬍70–130 K,1,5 and the ferroelectric ordering occurs at a
high temperature 共TE⬃600–990 K兲.1,2 RMnO3 crystallizes in two structural phases; the hexagonal phase when the ionic radius of R is small, and the orthorhombic phase when the ionic radius of R is rather large. Note that the ferroelectric ordering occurs only in the hexagonal phase of RMnO3, while the magnetic ordering occurs in both hexagonal and orthorhombic phases. In the hexagonal structure, each Mn ion is surrounded by three in-plane and two apical oxygen ions, and so it is subject to a trigonal crystal field.6 These MnO5blocks are connected two dimensionally through their corners, and the triangular lattice of Mn3+ ions is formed. These hexagonal RMnO3compounds experience characteris-tic distortions such as tilting of MnO5 blocks and the dis-placement of R3+ ions along the c axis, causing a ferroelec-tric polarization.6,7
There seems to be a strong coupling between the ferro-electric and magnetic ordering in hexagonal RMnO3 com-pounds. For example, a critical change of dielectric constants at TN has been reported for RMnO3 polycrystalline samples,8–10suggesting a coupling between the ferroelectric and magnetic ordering. Further, the coupled antiferromag-netic and ferroelectric domains have been observed in YMnO3,11and the magnetic phase of HoMnO3has been ob-served to be controlled by the electric field.12 In the optical study of LuMnO3,13a strong coupling of antiferromagnetism to the optical absorption spectra has been observed.
Understanding the origin of the coexistence of magnetism and ferroelectricity in hexagonal RMnO3 is a fundamental physics question, but has not been well understood yet. The
d0-ness rule is generally accepted in ferroelectricity. That is, a ferroelectric displacement of the B cation in ABO3 is in-hibited if the formal charge of the B ion does not correspond to a d0electron configuration due to the strong on-site Cou-lomb interaction between d electrons. In contrast, the occu-pancy of transition-metal d electrons is crucial in the mag-netic ordering. Thus the simultaneous magnetic and ferroelectric ordering in RMnO3 seems to break the d0-ness rule. It was suggested that the multiferroic property in RMnO3 is a result of the effective one-dimensional 共1D兲 d0-ness along the c axis.14,15 According to the electronic structure calculations,16,17the Mn3+ 共3d4兲 ion in YMnO3 is not a Jahn-Teller ion since the highest occupied 3d level
共dxy− dx2−y2兲 is nondegenerate because of the trigonal
sym-metry of the surrounding oxygen ions. The d3z2−r2 state is
mostly unoccupied so that this effective 1D d0 orbital along the c axis allows ferroelectricity to occur via the usual ligand-field stabilization mechanism. This is a plausible idea, but has not been confirmed experimentally yet.
In order to understand the origin of the multiferroicity in hexagonal RMnO3, it is important to investigate the elec-tronic structures of hexagonal RMnO3, including the valence states of Mn ions and the character of the lowest unoccupied 3d states of the Mn ion below and above the ferroelectric transition. In principle, these investigations are possible by employing the polarization-dependent soft x-ray absorption spectroscopy 共XAS兲 and valence-band photoemission spec-troscopy共PES兲 measurements. PES and XAS are powerful experimental methods for providing direct information on the electronic structures of solids. In practice, however, these spectroscopic measurements are not easy for these multifer-roic materials. Normally these systems are good insulators having wide band gaps, and so they are not good for electron spectroscopy studies. For the polarization-dependent experi-ments, single crystals are prerequisite. Further, it is difficult to study the changes in the electronic structure across TE PHYSICAL REVIEW B 71, 092405共2005兲
using these spectroscopy experiments because it is practi-cally not compatible with the ultrahigh vacuum required for the experiments to achieve these high temperatures
共TE⬃600–990 K兲.
In this paper, we report the valence-band PES, O 1s XAS, and Mn 2p XAS study of polycrystalline RMnO3
共R=Y,Er兲 samples at room temperature which belongs to
the paramagnetic ferroelectric phase. To our knowledge, this is the first reliable PES and XAS study on multiferroic samples. Only the core-level PES data for the sputtered YMnO3 films have been reported so far.18 This study pro-vides the information on the electronic structures of RMnO3
共R=Y,Er兲 in their ferroelectric and paramagnetic phases
even though we did not perform the polarization-dependent spectroscopy measurement across TEor TN.
Polycrystalline RMnO3 samples 共R=Y,Er兲 were synthe-sized by using the standard solid-state reaction method. Cat-ion oxides of R2O3 共R=Y,Er兲 共99.999%兲 and Mn2O3
共99.999%兲 were thoroughly mixed in order to achieve a
ho-mogeneous mixture. The mixed powders were heated to 900 ° C for 12 h and later they were annealed at 1100 ° C for 24 h and subsequently at 1200 ° C for 24 h before final sin-tering at 1350 ° C for 24 h with intermediate grindings. The purpose of intermediate grindings was to prevent the forma-tion of impurity phases. The x-ray diffracforma-tion共XRD兲 mea-surements at room temperature showed that all the samples have a single hexagonal RMnO3phase.
Valence-band PES, O 1s XAS, and Mn 2p XAS measure-ments were performed at the 8A1 undulator beamline of the Pohang Accelerator Laboratory 共PAL兲. Samples were cleaned in situ by repeated scraping with a diamond file and the data were obtained at room temperature with the pressure better than 4⫻10−10Torr. The Fermi level E
F共Ref. 19兲 and
the overall instrumental resolution 关full width at half maxi-mum 共FWHM兲兴 of the system were determined from the valence-band spectrum of a scraped Pd metal in electrical contact with samples. The FWHM was about 100– 400 meV between a photon energy h⬃130 eV and h⬇600 eV. All the spectra were normalized to the incident photon flux. The XAS spectra were obtained by employing the total electron yield method. The experimental energy resolution for the XAS data was set to ⬃100 meV at the O 1s and Mn 2p absorption thresholds共h⬇500–600 eV兲.
Figure 1 compares the Mn 2p XAS spectra of RMnO3
共R=Y,Er兲 to those of reference Mn compounds having
for-mal Mn valences of 3+共Mn2O3, reproduced from Ref. 20兲, 4+ 共MnO2 reproduced from Ref. 21兲, 2+ 共MnO reproduced from Ref. 21兲, and that of Mn metal 共reproduced from Ref. 22兲. The XAS data of MnO2, MnO, and Mn metal were shifted by −0.8, +1.0, and −1.3 eV, respectively, to allow for a better comparison of the data. It is well known that the peak positions and the line shape of the Mn 2p XAS spec-trum depend on the local electronic structure of the Mn ion, so that the 2p XAS spectrum provides the information on the valence state of the Mn ion.23,24Figure 1 shows clearly that the Mn 2p XAS spectra of RMnO3共R=Y,Er兲 are essentially identical to each other, and that they are very similar to that of Mn2O3. For comparison, they are quite different from those of MnO共2+兲, MnO2共4+兲, and Mn metal. This
obser-vation indicates that the valence states of Mn ions in RMnO3 are nearly trivalent 共Mn3+兲, with the 3d4 configuration, but far from being divalent 共Mn2+, 3d5兲 or tetravalent
共Mn4+, 3d3兲. This finding is consistent with the finding of Mn K-edge XANES,25 and with the general consensus of Mn3+ ions in the ionic bonding picture for hexagonal RMnO3.
If Mn ions in RMnO3 have the 3d4 configurations, then the next question would be which states are occupied, which states are unoccupied, and where these states are located with respect to EF. In order to answer these questions, we have
investigated the photoemission spectral weight distribution of Mn 3d electrons, by employing resonant photoemission spectroscopy 共RPES兲 near the Mn 2p→3d absorption threshold.
The top of Fig. 2 shows the valence-band RPES spectra of YMnO3 near the Mn 2p3/2 absorption edge. We have also done RPES measurements for ErMnO3, but the valence-band PES spectra have large contribution from Er 4f electron emissions, which overlap with both Mn 3d and O 2p emis-sions. So we do not present the PES data for ErMnO3in this paper. The inset shows the Mn 2p3/2 XAS spectrum of YMnO3, and the arrows in the XAS spectrum represent h’s where the valence-band spectra were obtained. The off-resonance valence-band PES spectrum共A兲 consists of both O 2p and Mn 3d electron emissions with comparable contribu-tions, but has the negligible contribution from Y s / p electron emissions.26 The top PES spectrum 共labeled as XPS兲 was obtained with h= 1486.6 eV, which belongs to the XPS limit. This XPS spectrum is very similar to the off-resonance spectrum共A兲, because, at h= 1486.6 eV, the O 2p and Mn 3d electron emissions are also of comparable magnitudes.26 The enhanced features near⬃7 eV binding energy at the Mn 2p→3d absorption energy 共B兲 represent the resonant Mn 3d electron emission. Therefore the difference between the on-resonance and off-on-resonance spectra can be considered to
FIG. 1. Comparison of the Mn 2p XAS spectra of YMnO3
共solid lines兲 and ErMnO3 共symbols兲 to those of Mn2O3 共Mn3+兲
共Ref. 20兲, MnO2共Mn3+兲 共Ref. 21兲, MnO 共Mn2+兲 共Ref. 21兲, and Mn
metal共Ref. 22兲.
BRIEF REPORTS PHYSICAL REVIEW B 71, 092405共2005兲
represent the bulk Mn 3d partial spectral weight 共PSW兲 distribution.27 The vertical bars, marked for those features that shift away from EF with increasing h, denote the Mn LMM Auger emission that appears at a fixed kinetic energy
共KE兲 of KE ⬃634 eV.28 These Auger peaks also reveal the intensity enhancement near the Mn 2p absorption threshold. It is known that the transition-metal共T兲 Auger peaks show the resonant behavior near the T 2p→3d RPES.29
The bottom of Fig. 2 presents the extraction procedure of the Mn 3d PSW for YMnO3. As a first approximation, it is taken as the difference between the Mn 2p→3d on-resonance spectrum共solid line兲 and off-resonance spectrum
共gray line兲. In this extraction procedure, we have used the
on-resonance spectrum at B, instead of C or D, to reduce the effect of the Mn Auger contribution. The extracted Mn 3d PSW exhibits a peak centered at⬃7 eV binding energy with an asymmetric and long tail to the high binding energy side
共up to ⬃15 eV兲. Part of this high binding tail is ascribed to
the underlying Mn Auger peak. The extracted Mn 3d PSW for YMnO3shows that Mn 3d states are located well below EFbut that there is nearly no Mn 3d occupied states near EF. Note that both the off-resonance spectrum 共A兲 and the h= 1486.6 eV XPS spectrum represent a mixture of O 2p and Mn 3d emissions. Therefore the bottom part of Fig. 2 reveals that the occupied Mn 3d states lie in the middle of the O 2p states and that they overlap with the O 2p states very much, having the comparable widths to those of the O 2p states. This finding implies the strong hybridization be-tween Mn 3d and O 2p states.
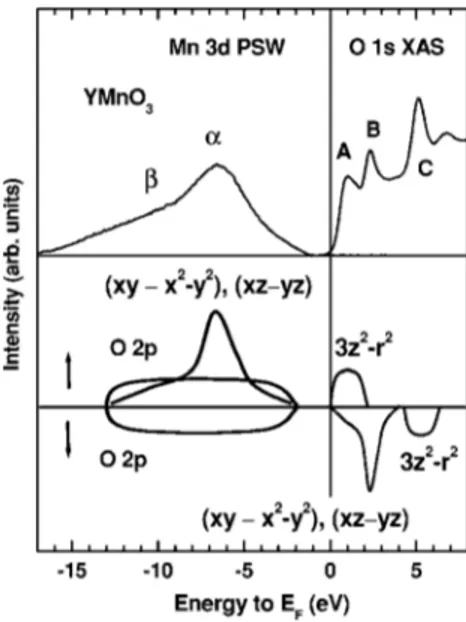
Figure 3 shows the combined Mn 3d PSW and the O 1s XAS spectrum of YMnO3.30The O 1s XAS spectrum repre-sents the transition from the O 1s core level to the
unoccu-pied O 2p states which are hybridized with the other elec-tronic states, so it provides a reasonable estimate of the unoccupied conduction bands. The peaks A, B, C in the O 1s XAS spectrum of YMnO3 have also been observed in ErMnO3and they were very similar to each other, indicating that they have mainly the O 2p-Mn 3d character. At the bottom of Fig. 3, we also provide a schematic diagram for the partial densities of states共PDOS兲 for YMnO3. We have determined this schematic PDOS diagram through the com-parison of the PES/XAS data and the LSDA+ U band calcu-lations共LSDA: local spin-density approximation, U: on-site Coulomb interaction兲 for YMnO3.16,17 Our PES/XAS data agree better with the LSDA+ U calculations than with the LSDA calculations. This finding is plausible because the on-site Coulomb interaction between Mn d electrons is expected to be strong. But the employed U = 8 eV in the existing LSDA+ U calculations seems to be too large for YMnO3, as discussed below.
The features observed in the PES/XAS are ascribed to the following states.␣: the occupied Mn 3d states consisting of the narrow共dxz↑−dyz↑兲 states, which are superposed on top of the rather broad共dxy↑−dx2−y2↑兲 states,共the high binding
energy shoulder to␣兲: the Mn Auger peak,␣+共the broad valence-band PES features underneath the Mn 3d states兲: the O 2p states. Note that the occupied O 2p states are hybrid-ized with Mn 共dxy− dx2−y2兲 states, consistent with the
band-structure calculations.16,17In the XAS side, the marked peaks represent the following states. A: the unoccupied Mn d3z2−r2↑
states, B: the unoccupied Mn 共dxy↓−dx2−y2↓兲 and 共dxz↓−dyz↓兲 states, C: the unoccupied Mn d3z2−r2↓
states. Thus the state just above EF corresponds to Mn d3z2−r2↑, and so the trivalent Mn3+ ions in RMnO3 are in
the high-spin state 共S=2兲 with the configuration of
共dxz↑−dyz↑兲2共dxy↑−dx
2−y2↑兲2. Considering the uncertainty in
the binding energy calibration of PES data,19 the energy separation between the peak␣in the valence-band PES and
FIG. 2. Valence-band PES spectra of YMnO3 near the Mn 2p3/2→3d absorption edge. Inset: The Mn 2p3/2XAS spectrum of YMnO3. Arrows denote h’s where the valence-band PES spectra were obtained. Bottom: Comparison of the on-resonance共solid line兲 and off-resonance valence-band PES spectra 共gray line兲 in Mn 2p→3d RPES, and the difference between these two 共open dots兲.
FIG. 3. Top: Combined Mn 3d PSW and O 1s XAS for YMnO3.
Bottom: The schematic diagram for the Mn 3d PDOS of YMnO3.↑
and↓ represent the majority- and minority-spin states, respectively.
BRIEF REPORTS PHYSICAL REVIEW B 71, 092405共2005兲
the peak A in the O 1s XAS amounts to 7⬃8 eV. Then this value gives a rough measure of U +⌬CF共Ref. 31兲 共⌬CF: the crystal-field splitting between d3z2−r2 and dxz− dyz兲.
Employ-ing⌬CF⬇2 eV from the LSDA band structure calculation,16 the estimated value of U would be of the order of 5 – 6 eV. Hence the present spectral data indicate that the Mn 3d Cou-lomb interaction U is not as large as that 共U=8 eV兲 em-ployed in Refs. 16 and 17. The energy separation 共⬃2 eV兲 between the top of the valence band and the peak A in the O 1s XAS is expected to correspond to the lowest energy peak in the optical absorption spectrum for YMnO3.18,32 We as-cribe this energy separation to the energy difference between the occupied O 2p states, which are strongly hybridized to the 共dxy↑−dx2−y2↑兲 states, and the unoccupied Mn d3z2−r2↑
states.
Note that the extracted Mn 3d PSW shows negligible spectral weight near EF. Thus our schematic PDOS diagram
shown in Fig. 3 implies that the topmost electronic states in the valence bands of YMnO3共those closest to EF兲 are mostly
O 2p states. According to this picture, the lowest-energy op-tical transition would be the O p-Mn d transition, suggesting that YMnO3is likely to be a charge-transfer insulator. Note-worthy is that our model for the electronic structure of YMnO3is different from that proposed from the optical ab-sorption study of LuMnO3,13 where a sharp peak at 1.7 eV
共even at room temperature兲 was ascribed to the on-site Mn
d-d transition. In contrast, similar absorption peaks were ob-served in RMnO3共R=Sc, Y, Er兲, and they were interpreted as
arising from charge transfer from O 2p to Mn 3d states.32 The present PES/XAS data indicate that the latter interpreta-tion is more consistent with the real electronic structures in RMnO3.
In conclusion, the electronic structures of hexagonal mul-tiferroic RMnO3共R=Y, Er兲 materials have been investigated by employing Mn 2p→3d RPES, Mn 2p XAS, and O 1s XAS. The Mn 2p XAS spectra of RMnO3共R=Y, Er兲 show that Mn ions are in the formally trivalent Mn3+states, imply-ing the共dxz↑−dyz↑兲2共dxy↑−dx
2−y2↑兲2configurations with the
total spin of S = 2 per Mn ion. According to Mn 2p→3d RPES for YMnO3, the occupied Mn共dxz− dyz兲 states lie very
deep below EF, with a peak around⬃7 eV binding energy.
The occupied Mn共dxy− dx2−y2兲 states overlap with the O 2p
states very much, but show negligible Mn 3d spectral weight above the O 2p states, suggesting that YMnO3is likely to be a charge-transfer insulator. The lowest unoccupied peak in the O 1s XAS is ascribed to the unoccupied Mn d3z2−r2state.
This finding is compatible with the recent structural studies of RMnO3,6,7 which show tilting of MnO5 blocks in their ferroelectric phases.
We thank S.-W. Cheong for helpful discussions. This work was supported by the KRF共Grant No. KRF-2002-070-C00038兲 and by the KOSEF through the CSCMR at SNU and the eSSC at POSTECH. The PAL is supported by the MOST and POSCO in Korea.
*Electronic address: kangjs@catholic.ac.kr
1E. F. Bertaut et al., Acad. Sci., Paris, C. R. 256, 1958共1963兲. 2H. L. Yakei et al., J. Appl. Crystallogr. 16, 957共1963兲. 3G. A. Smolenskii and I. E. Chupis, Sov. Phys. Usp. 25, 475
共1982兲.
4H. Schmid, Ferroelectrics 162, 317共1994兲. 5W. C. Koehler et al., Phys. Lett. 9, 93共1964兲. 6T. Katsufuji et al., Phys. Rev. B 64, 104419共2001兲. 7B. B. van Aken et al., Nat. Mater. 3, 164共2004兲. 8Z. J. Huang et al., Phys. Rev. B 56, 2623共1997兲.
9N. Iwata and K. Kohn, J. Phys. Soc. Jpn. 67, 3318共1998兲. 10T. Kimura et al., Nature共London兲 426, 55 共2003兲. 11M. Fiebig et al., Nature共London兲 419, 818 共2002兲. 12T. Lottermoser et al., Nature共London兲 430, 541 共2004兲. 13A. B. Souchkov et al., Phys. Rev. Lett. 91, 027203共2003兲. 14N. A. Hill and A. Filippetti, J. Magn. Magn. Mater. 242-245, 976
共2002兲.
15N. A. Spandin and W. E. Pickett, J. Solid State Chem. 176, 615
共2003兲.
16J. E. Medvedeva et al., J. Phys.: Condens. Matter 12, 4947
共2000兲.
17M. Qian et al., Phys. Rev. B 63, 155101共2001兲. 18W. C. Yi et al., J. Phys. Soc. Jpn. 69, 2706共2000兲. 19Since RMnO
3samples are insulating, there is some ambiguity in
determining EF. However, no time-dependent charging effects were observed in the valence-band PES spectra of RMnO3.
Therefore the absolute values of binding energies in these data have some uncertainties, but the relative energy separations are meaningful.
20P. Ghigna et al., Phys. Rev. B 64, 132413共2001兲. 21C. Mitra et al., Phys. Rev. B 67, 092404共2003兲. 22Y. Yonamoto et al., Phys. Rev. B 63, 214406共2001兲. 23F. M. F. de Groot et al., Phys. Rev. B 42, 5459共1990兲. 24G. van der Laan and I. W. Kirkman, J. Phys.: Condens. Matter 4,
4189共1992兲.
25C. T. Wu et al., Physica B 329-333, 709共2003兲.
26J. J. Yeh and I. Lindau, At. Data Nucl. Data Tables 32, 1共1985兲,
where calculated atomic photoionization cross sections are given.
27J.-S. Kang et al., Phys. Rev. B 66, 113105共2002兲.
28Handbook of Auger Electron Spectroscopy, edited by C. L.
Herdberg, 3rd ed. 共Physical Electronics, Inc., Minnesota, 1995兲.
29J.-S. Kang et al., Phys. Rev. B 68, 012410共2003兲.
30In this comparison, the inelastic background has been subtracted
in the Mn 3d PSW, and the O 1s XAS spectrum has been shifted by −530 eV by referring to the optical gap size of YMnO3. 31Here it is implicitly assumed that the occupied␣ and unoccupied
A peaks correspond to the dn→dn−1and dn→dn+1transitions,
respectively.
32A. M. Kalashnikova and R. V. Pisarev, JETP Lett. 78, 143
共2003兲.
BRIEF REPORTS PHYSICAL REVIEW B 71, 092405共2005兲