R E S E A R C H
Open Access
Human three-dimensional in vitro model of
hepatic zonation to predict zonal
hepatotoxicity
Jaehwan Ahn
1,2, Jun-Ho Ahn
2, Seokjoo Yoon
2, Yoon Sung Nam
1*, Mi-Young Son
3,4*and Jung-Hwa Oh
2*Abstract
Background: Various hepatic models mimicking liver lobules have been investigated to evaluate the potential hepatotoxic effects of chemicals and drugs, but in vitro hepatic models of zonal hepatotoxicity have not yet been established. Herein, we developed a three-dimensional (3D) hepatic zonal channel to evaluate zone-specific hepatotoxicity. Based on the perivenous zone-3-like cytochrome P450 (CYP) expression patterns in metabolically active HepaRG cells treated with CHIR99021 (CHIR), which is an inducer of Wnt/β-catenin signaling, this culture model represents a novel tool for exploring hepatic zonation.
Results: We generated and validated a 3D hepatic zonal channel model in which 3D HepaRG cells were well distributed in agarose hydrogel channels, and a linear gradient of CHIR was generated according to the zonal distance. According to the results from imaging analyses and bioanalytical experiments, acetaminophen (APAP) caused cytotoxicity in the zone-3 region of the 3D hepatic zonal channel, and the levels of nonphosphorylated β-catenin, CYP2E, and apoptotic proteins were remarkably increased in the zone-3-like region. Finally, the applicability of the 3D hepatic zonal channel model for the high-throughput screening of zonal hepatotoxicity was successfully evaluated using hepatotoxic drugs, including tamoxifen, bromobenzene, and APAP.
Conclusions: The results indicated that tamoxifen induced cytotoxic effects, regardless of the zonal distance, while the zone-3-specific hepatotoxic drugs bromobenzene and APAP induced greater cytotoxic effects on cells in the zone-3-like region. This finding highlights the potential of our 3D hepatic zonation model as a valuable tool for replicating and evaluating zonal hepatotoxicity by mimicking the spatial features of liver lobules.
Keywords: Liver zonation, Zonal hepatotoxicity, Alternative hepatic model, Drug screening, Wnt/β-catenin, CYP activities Background
The liver plays key roles in homeostasis, including drug metabolism, and hepatic functions are highly specialized according to the spatial location along the portal-central vein axis of the liver lobule [1, 2]. The area from the portal triads to the hepatic vein is divided into three regions: zone-1, periportal area; zone-2, midzonal area; and zone-3, perivenous area. Hepatocytes exhibit func-tional heterogeneity in the liver lobule depending on
their zonal location, which is known to be affected by the cellular microenvironment, such as blood oxygen,
nutrient, and hormone concentrations [3, 4].
Hepato-cytes located in the oxygen-rich zone-1 region perform hepatic functions, such as gluconeogenesis, β-oxidation, cholesterol synthesis and ureagenesis and are vulnerable to reactive oxygen species; however, these hepatocytes rapidly recover [5,6]. Hepatocytes located in the zone-3 region express high levels of cytochrome P450, which metabolizes xenobiotic chemicals and performs functions such as lipogenesis, glycolysis, bile acid synthesis and glutamine synthesis [7, 8]. The compartmentalization of gene expression in the liver might underlie the ability of the tissue to control the pattern of zonal hepatotoxicity observed with some xenobiotics, such as acetaminophen (APAP), and several environmental agents [9].
* Correspondence:yoonsung@kaist.ac.kr;myson@kribb.re.kr;jhoh@kitox.re.kr 1Department of Material Science and Engineering, Korea Advanced Institute
of Science and Technology (KAIST), Daejeon 34141, Republic of Korea
3
Stem Cell Research Center, Korea Research Institute of Bioscience and Biotechnology (KRIBB), Daejeon 34141, Republic of Korea
2Department of Predictive Toxicology, Korea Institute of Toxicology (KIT),
Daejeon 34114, Republic of Korea
Full list of author information is available at the end of the article
© The Author(s). 2019 Open Access This article is distributed under the terms of the Creative Commons Attribution 4.0 International License (http://creativecommons.org/licenses/by/4.0/), which permits unrestricted use, distribution, and reproduction in any medium, provided you give appropriate credit to the original author(s) and the source, provide a link to the Creative Commons license, and indicate if changes were made. The Creative Commons Public Domain Dedication waiver (http://creativecommons.org/publicdomain/zero/1.0/) applies to the data made available in this article, unless otherwise stated.
Several studies have developed a reliable hepatic model to screen drug-induced hepatotoxicity. Monolayered he-patocytes, such as HepaRG and primary human hepato-cytes, exhibiting drug-metabolizing activities have been used to screen hepatotoxicity, and three-dimensional (3D) hepatic spheroid models have recently been devel-oped because these models exhibit more hepatic func-tions than a monolayer culture [10–12]. However, these hepatic models employ a homogenous population of hepatocytes, and therefore, an evaluation of zonal hep-atotoxicity is difficult, which is indeed observed in vivo. Several studies aiming to develop an in vitro model of liver zonation that predicts zonal hepatotoxicity have been reported [13,14]. Allen et al. designed a bioreactor system to generate an oxygen gradient and confirmed that cytochrome P450 (CYP) 2B levels were modulated by the oxygen gradient [14]. McCarty et al. developed a microfluidics system to mimic different hepatic func-tions according to the spatial location by modulating the gradients of exogenous hormones, including insulin and glucagon, and chemical induction agents. However, in vitro models that recapitulate the observed variations in the liver microenvironment and affect cell signaling and metabolic liver zonation are limited.
Oxygen and theβ-catenin pathway are potential factors that modulate zonal metabolism in the liver [15, 16]. Oxygen is an electron acceptor in energy metabolism, and dissolved free oxygen concentrations are approximately
60–65 mmHg in the periportal blood and decrease to
approximately 30–35 mmHg in the perivenous blood; this difference regulates zonal metabolism [4]. The dissolved free oxygen concentrations differ between periportal and perivenous blood vessels in vivo, and this difference in concentrations according to spatial zonation are rarely controlled in vitro. However, an oxygen gradient alone is not sufficient to reflect zonal metabolism in hepatocytes [17, 18]. Wnt/β-catenin signaling is known to be a key signaling pathway that regulates the expression of drug-metabolizing enzymes [19, 20]. Wnt/β-catenin signaling was also highlighted as a key endogenous regulator of the expression of drug-metabolizing enzymes, such as hepatic CYPs [21]. CHIR99021 (CHIR), a highly selective inhibitor of glycogen synthase kinase-3 (GSK3β), is a strong inducer that activates Wnt/β-catenin signaling [22]. In this study, we attempted to induce the differential expression and activation of drug-metabolizing enzymes to mimic zonal liver metabolism by modulating Wnt/β-catenin signaling. A gradient of CHIR concentrations generated zonal tox-icity responses in HepaRG cells by inducing the expres-sion and activity of zone-3-specific CYPs.
To the best of our knowledge, this study is the first to establish an in vitro model of hepatic zonation by modu-lating the zonal expression of genes encoding Phase I drug-metabolizing enzymes in hepatocytes by regulating
Wnt/β-catenin signaling. Based on these findings, we
successfully designed and validated a novel 3D hepatic zonal channel model in which the zonal hepatotoxicity of compounds is detected using direct imaging analyses and bioanalytical experiments. By evaluating drug-induced zonal hepatotoxicity, this 3D biomimetic hepatic zonation system represents a novel tool for elucidating liver zonation and its physiological and pathophysiological implications.
Results
Modulation of the activities of drug-metabolizing cytochrome P450 enzymes by a CHIR treatment
We focused on zonal characteristics of CYP heterogen-eity and first evaluated the viability of HepaRG cells and the mRNA expression levels of human CYP isoforms after treatment with different concentrations of CHIR. The fully differentiated HepaRG cells were treated with CHIR for 10 days, and the medium supplemented with an appropriate concentration of CHIR was replaced every 3 days. In the cell viability assay using CCK-8 reagents, the relative viability of HepaRG cells was slightly increased in a dose-dependent manner during
the 10 days of treatment with CHIR (Additional file 1:
Figure S1A) and hepatocyte-like morphology was ob-served in HepaRG cells before and after treatment with CHIR (Additional file 1: Figure S1B). This CHIR-induced increase in the viability of HepaRG cells is consistent with the findings of a previous investigation showing that CHIR induced the proliferation of human cardiomyocytes by upregulatingβ-catenin expression [23]. After exposure to various concentrations of CHIR for 3 days, the mRNA
levels of several isotypes of CYPs, including CYP2B6,
CYP1A2, CYP2E1, and CYP3A4, were measured using
qRT-PCR. CYP2B6 is generally expressed in the liver
without spatial specification [24], and CYP1A2, CYP2E1,
and CYP3A4 are predominantly expressed in the zone-3
region of the hepatic lobule [25]. Interestingly, as the
CHIR concentration increased, the levels of the CYP2E1
andCYP3A4 mRNAs increased 5-fold compared with the
untreated control cultures of differentiated HepaRG cells
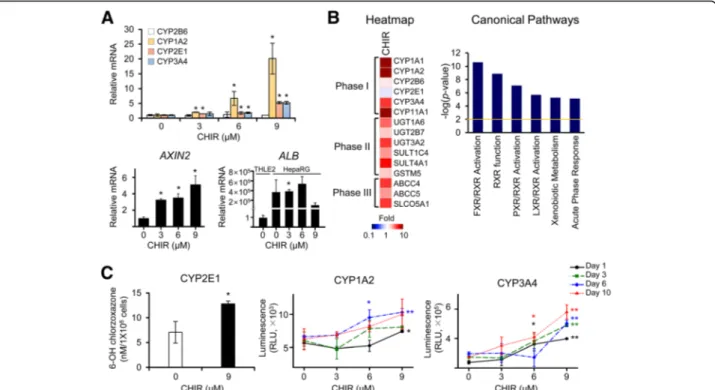
(Fig. 1a). Remarkably, CYP1A2 mRNA expression was
strongly induced, reaching a 20-fold maximal effect after
treatment with 9μM CHIR. The expression of CYP2B6
was not noticeably changed by any treatment condition. Based on these findings, at concentrations greater than
6μM, CHIR induces the transcription of specific CYP
subfamily members, which are expressed in perivenous hepatocytes in zone-3, in a dose-dependent manner. In other human hepatocytes, including normal THLE2 and cancerous Huh7 cell lines, significant changes in CYP2E1
and CYP3A4 expression were not observed in THLE2
cells, and a 3 day CHIR treatment only increased the level
of the CYP2E1 mRNA in Huh7 cells (Additional file 2:
CYP expression in metabolically competent HepaRG cells than in normal THLE2 hepatocytes and Huh7 hepatocar-cinoma cells. Levels of theAXIN2 mRNA, a representative
target gene of β-catenin, were increased in response to
treatment with CHIR in a dose-dependent manner, showing that CHIR activated Wnt/β-catenin signaling in HepaRG cells (Fig.1a). We also confirmed that the levels
of ALB (albumin) mRNA, a marker of hepatic function,
were remarkably increased in CHIR-treated HepaRG cells than in THLE2 controls (Fig.1a).
To evaluate the molecular changes in HepaRG cells in response to treatment with CHIR, we analyzed the global changes in gene expression using a microarray experiment. DEGs (differentially expressed genes) were identified by filtering to select genes with an at least 2-fold change in expression that was statistically signifi-cant (P < 0.01) compared to the control, resulting in the identification of 3058 DEGs in cells treated with CHIR. As shown in the heatmap of the genes related to drug metabolism (Phase I, II and III), most of the Phase I
CYPs, including CYP1A1, CYP1A2, and CYP3A4, and
several Phase II enzymes and Phase III transporters were
overexpressed in the CHIR-treated group (Fig. 1b).
Unlike the qRT-PCR results, CYP2E1 expression was
slightly decreased in the microarray, which may be due to the use of a different probe region (for exon 7) than the primer region (for exon 11) used in the qRT-PCR. The canonical pathways of DEGs were analyzed using IPA. Genes related to xenobiotic metabolism, including FXR/RXR, RXR, PXR/RXR, and LXR/RXR functions, were selected as key pathways that were differentially regulated in the CHIR-treated group (Fig.1b).
Additionally, we assessed the activities of CYP2E1, CYP1A2, and CYP3A4, which are specific CYPs expressed in zone-3, in HepaRG cells treated with serial concentra-tions of CHIR for up to 10 days (Fig.1c). The enzymatic activities of perivenous region-specific CYP1A2, CYP2E1, and CYP3A4 were remarkably increased in HepaRG cells treated with CHIR. Their expression levels peaked in cells treated with 9μM CHIR. Collectively, the CHIR treatment
Fig. 1 Changes in the expression and activity of CYP enzymes in HepaRG cells induced by the CHIR treatment. The expression of the CYP mRNAs and enzymatic activities of CYPs (CYP2B6, CYP1A2, CYP2E1, and CYP3A4) were analyzed in CHIR-treated HepaRG cells. a Fully differentiated HepaRG cells were exposed to various concentrations of CHIR. The relative levels ofCYPs, AXIN2, and ALB (albumin) mRNAs in HepaRG cells were examined after 3 days of CHIR treatment using qRT-PCR. The relative level ofALB was calculated in the HepaRG cells before and after CHIR treatment comparing with THLE2 cells. The basal expression level ofALB mRNA in HepaRG cells was remarkably greater than that of THLE2 cells (b) A microarray analysis was performed using HepaRG cells that had been treated with 9μM CHIR for 3 days. The heatmap of genes involved in drug metabolism was analyzed using Gene-E software, and canonical pathways of differentially expressed genes (2-fold,P < 0.01) were analyzed using IPA software. c Enzymatic activities of CYPs in HepaRG cells treated with CHIR for up to 10 days. The activities of CYP1A2 and CYP3A4 were measured using the P450-Glo CYP assay, and the CYP activity values were normalized to cell number by dividing the P450-Glo luminescence values by the CCK-8 absorbance values, according to the manufacturer’s instructions. CYP2E1 activity was measured by determining the conversion of chlorzoxazone to OH-chlorzoxazone using HPLC-tandem mass spectrometry. All data are presented as the means ± SD.*P < 0.05 and**P < 0.01 compared with the untreated group at each time point; Student’s t-test
increased the activities of several CYP isotypes, which is similar to the phenomenon observed in the perivenous region (zone-3).
Generation of the zonal drug toxicity responses of HepaRG cells treated with CHIR
We next evaluated the cytotoxic effects of hepatotoxic drugs in HepaRG cells after pretreatment with or with-out CHIR. Differentiated HepaRG cells were pretreated
with or without 9μM CHIR and the viability was
exam-ined using a CCK-8 assay on day 2 after treatment with four different hepatotoxic drugs. Tamoxifen, bromoben-zene, isoniazid, and APAP were used as hepatotoxic drugs, and these drugs form toxic intermediates through the actions of Phase I enzymes. Tamoxifen and isoniazid
are CYP3A4-mediated hepatotoxic drugs, whereas
bromobenzene and APAP are CYP2E1- and CYP1A2-mediated hepatotoxic drugs. In the histopathological observations of a rat model derived from the publicly available Open TG-GATEs database, tamoxifen and isoniazid induce hepatotoxic effects across the overall region of the hepatic lobule, while bromobenzene and APAP cause hepatotoxicity in the perivenous region of zone-3 (Additional file3: Figure S3). The viability of four hepatotoxic drugs was evaluated in HepaRG cells at 3
days after pretreatment with 9μM CHIR to mimic the
microenvironment of zone-3. CHIR-treated HepaRG cells exhibited different patterns of dose-response curves for each drug; these patterns could be used to classify drugs into two groups, sensitive or insensitive to the
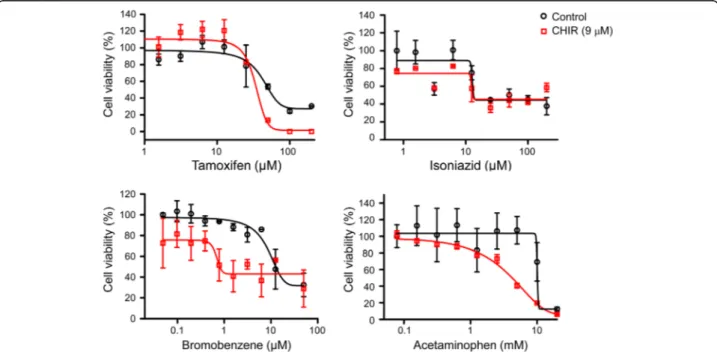
CHIR concentration. The cytotoxic effects of tamoxifen and isoniazid were similar for untreated control and
CHIR-treated HepaRG cells (Fig.2, upper panels).
How-ever, the cytotoxic effects of bromobenzene and APAP increased in cells treated with 9μM CHIR (Fig.2, lower
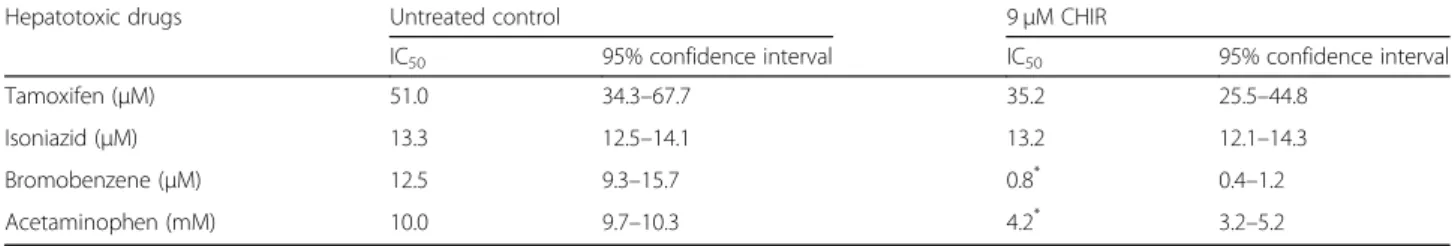
panels). The IC50 values of the four hepatotoxic drugs
indicated that the cytotoxic effects of bromobenzene and APAP were significantly different, depending on
CHIR concentration (Table1). The results demonstrated
that the CHIR could induce the zonal toxicity responses in HepaRG cells by modulating the expression and activity of CYP2E1 and CYP1A2.
Development of a 3D biomimetic hepatic zonation system
We designed a 3D hepatic zonal channel that mimics the microenvironment of liver zonation and is capable of screening zonal hepatotoxicity. A schematic of the
procedure is presented in Fig. 3a. Briefly, an agarose
hydrogel containing differentiated HepaRG cells was injected into the biocompatible polyolefin tube and HepaRG cells were encapsulated in an agarose hydrogel and then grown in a 3D structure in a polyolefin tube for 7 days. CHIR was linearly diffused in the polyolefin tube containing 3D cultures of HepaRG cells for 7 days and the test chemicals were then added to the intact or sliced pieces of the 3D hepatic zonal channel. Finally, zonal toxicity was evaluated in vitro using an imaging analysis. We first evaluated the cell viability and distribu-tion of 3D HepaRG cultures in the polyolefin tube
Fig. 2 Cell viability of HepaRG cells treated with four hepatotoxic drugs after CHIR pretreatment. The hepatotoxic drugs tamoxifen, isoniazid, bromobenzene, and APAP were administered to HepaRG cells pretreated with CHIR for 3 days. After 3 days of hepatotoxic drug treatment, the cell viability of HepaRG cells was measured using the CCK-8 assay, and the dose-response curve was analysed using GraphPad Prism software
(Additional file 4: Figure S4). During the long-term cul-ture for 11 days, the cell viability and distribution of 3D HepaRG cultures were examined on days 3, 6, and 11 using confocal imaging after staining with dual live/dead cell dyes. The confocal microscopy images of the top,
cross, and side sections showed that the 3D cultures of HepaRG cells in the agarose hydrogel were well distrib-uted in the polyolefin tubes (Additional file 4: Figure S4A). The viability of HepaRG cells was not significantly affected by the 3D culture conditions in the agarose Table 1 The cytotoxic concentration of hepatotoxic drugs in CHIR-treated HepaRG cells
Hepatotoxic drugs Untreated control 9μM CHIR
IC50 95% confidence interval IC50 95% confidence interval
Tamoxifen (μM) 51.0 34.3–67.7 35.2 25.5–44.8
Isoniazid (μM) 13.3 12.5–14.1 13.2 12.1–14.3
Bromobenzene (μM) 12.5 9.3–15.7 0.8* 0.4–1.2
Acetaminophen (mM) 10.0 9.7–10.3 4.2* 3.2–5.2
P-values indicate significant differences between the IC50values of hepatotoxic drugs after CHIR treatment. * P < 0.05
Fig. 3 Development of the in vitro 3D hepatic zonation platform. a Schematic flow of the zonal hepatotoxicity evaluation system using the 3D hepatic zonal channel model. An agarose hydrogel gel containing HepaRG cells was injected into the polyolefin tube, and 3D HepaRG cells were cultured in the gel matrix for 7 days. For natural diffusion, 0.1% DMSO and 9μM CHIR were located at the left (Inlet 1) and right side (Inlet 2) of the channel, respectively. The 3D hepatic zonal channel can be sliced into several pieces representing zone-1-like, zone-2-like and zone-3-like sections with the installed guide and then treated with hepatotoxic chemicals. b The relative CHIR diffusion in the 3D hepatic zonal channel was monitored for up to 15 days by UV illumination using the ChemiDoc XRS+ Imaging System. The intensity of CHIR across the 3D hepatic zonal channel was imaged using the MATLAB program. c The relative intensity of CHIR according to the distance from Inlet 1 to Inlet 2 was quantified using the MATLAB program and plotted. d The intensity-concentration curves for each time point were analysed with the curve-fitting method, and the linearity was calculated from the limit (lim) of tangentƟ approaching 50% of the distances. A tangent value close to 1 indicates the most linearity. On day 7, the CHIR concentration profile was close to a linear diffusion gradient in the 3D hepatic zonal channel
hydrogel compared with the conventional monolayer 2D culture conditions (Additional file 4: Figure S4B). The analysis of live and dead cells showed that a high pro-portion of live cells was maintained on day 6, but the proportion of dead cells increased on day 11 (Additional file 4: Figure S4C). In the case of long-term cultivation using the 3D model, the necrotic cores caused by limited oxygen diffusion is a critical issue [26]. According to a
previous study, 3D HepaRG spheroids less than 200μm
in size were suitable for long-term culture for up to 21
days without forming necrotic cores [11]. However,
high-throughput screening using 3D hepatic spheroid and scaffold model have been performed at less than 7 days because the variations in size, viability and func-tionality are difficult to control [27,28]. The results from the present study showing a high proportion of viable cells up to day 6 are comparable to long-term cultivation in the previous investigations.
To generate a 3D hepatic zonal channel, we intro-duced CHIR at one end (Inlet 2) of the tube and culture medium at the opposite end (Inlet 1) of the polyolefin
tube (Fig. 3a). CHIR diffused through agarose hydrogel
channels containing 3D HepaRG from Inlet 2 (9μM
CHIR with medium containing 0.1% DMSO) towards In-let 1 (medium containing 0.1% DMSO). The 3D hepatic zonal channel was separated by the installed guide to divide the channel into a zone-1-like section (the peri-central region) and a zone-3-like section (the perivenous region). We optimized the time of diffusion, which can provide the linear gradient of CHIR in the 3D hepatic
zonal channel from Inlet 2 to Inlet 1 (Fig. 3b-d). The
diffusion behavior of CHIR through agarose hydrogel channels was visualized using a UV illuminator, and the CHIR concentration in images was analyzed using
MATLAB software (Fig. 3b). CHIR possesses an
aro-matic ring that absorbs UV light and emits at 305 nm. In a previous study, the diffusion coefficient of rhodamine B (479 g mol− 1), which has a similar molecular weight to CHIR (465.34 g mol− 1), was calculated in a 1% agarose hydrogel [29], and the relative diffusion coefficient was estimated based on the ratio of the molecular weights.
DCHIR DRhB ¼ ffiffiffiffiffiffiffiffiffiffiffiffiffiffiffiffi MwRhB MwCHIR 3 r
We assumed that diffusion through the agarose hydro-gel channel occurs in one dimension, and the diffusion solute has a spherical geometry with a radius propor-tional to the molecular weight. The diffusion coefficient of rhodamine B is approximately 2.96 × 10− 6cm2/s, and the similar diffusion coefficient of CHIR in the 3D hep-atic zonal channel was estimated to be 2.98 × 10− 6cm2/s. The CHIR concentration at various times of day was
quantified using MATLAB and plotted (Fig. 3c). The
intensity-concentration curves were analyzed with a curve-fitting method and the linearity was calculated based on the tangent at 50% of the distance according to the period to determine the optimum diffusion time for CHIR to develop a linear gradient across the zonal chan-nel (Fig.3d). The results demonstrated that 7 days is the optimum period to obtain a linear gradient of CHIR in the 3D hepatic zonation model.
Application of the 3D hepatic zonation model to evaluate zonal hepatotoxicity in vitro
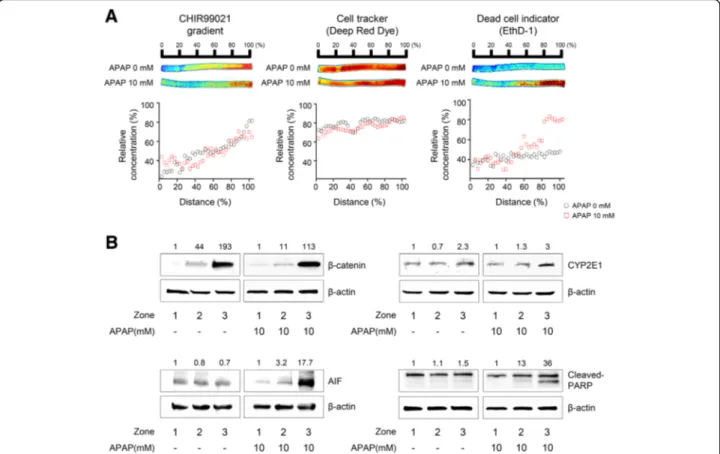
To demonstrate the practical utility of our 3D hepatic zonal channel model, we first applied it to evaluate zonal hepatotoxicity. HepaRG cells in polyolefin tubes were treated with test chemicals in the well-based culture platform. After treatment with the test chemicals, a 3D hepatic zonal strip comprising HepaRG cells in polyole-fin tubes was sliced into several pieces and labeled as distance (%), zone or section number, depending on the user’s evaluation methods, such as live imaging, cell viability assays, or biosample analyses. APAP, a zone-3-specific hepatotoxic drug, was used to quantify zonal hepatotoxicity in the 3D hepatic zonal channel model using an imaging analysis (Fig.4a). After 7 days of CHIR diffusion in the zonal channel, the intact 3D hepatic zonal channel extracted from the tube was treated with APAP for 2 days, directly imaged, and evaluated using a ChemiDoc system after staining with dual live/dead cell dyes. We confirmed the distribution of CHIR in the 3D hepatic zonal channel to compare the proportion of live and dead cells according to the gradient of CHIR, and the distribution profile of CHIR after 7 days of diffusion in the zonal channel showed that CHIR diffused in a manner that led to a concentration gradient (Fig.4a, left panels). HepaRG cells were prestained with CellTracker Deep Red fluorescent probes before being loaded in the polyolefin tubes. HepaRG cells were uniformly dispersed throughout the agarose hydrogel channel in the
polyole-fin tubes, regardless of the distance (Fig. 4a, middle
panels). After a 10 mM APAP treatment for 2 days, the cytotoxic effects on 3D HepaRG cells were evaluated with EthD-1 staining, an indicator of cellular membrane damage. In the region with a high CHIR concentration mimicking zone-3, 3D HepaRG cells were more severely damaged by the APAP treatment than at the point in the channel farther from the initial diffusion point of CHIR (Inlet 2) (Fig.4a, right panels). These data indicated that zonal hepatotoxicity can be quantitatively evaluated using a 3D hepatic zonal channel model by imaging analysis.
The 3D hepatic zonal channel permits molecular experimental approaches, such as western blotting, using the 3D HepaRG cells recovered from the channel. The 3D HepaRG sample was recovered from the 3D hepatic zonal channel and then divided into 3 pieces corresponding to
the zonal regions, according to a distance guide. After treatment with 10 mM APAP, we purified the proteins from 3D HepaRG, and the expression levels of several target proteins involved in APAP metabolism and hepato-toxicity were evaluated by western blotting (Fig.4b). The
non-phosphorylated β-catenin expression was higher in
the zone-3-like region than in the zone-1- or zone-2-like regions, indicating that GSK3β was effectively inhibited by CHIR in both the untreated and APAP-treated channels (Fig.4b, top left panels). The level of CYP2E1 increased 2-to 3-fold in the zone-3-like region compared 2-to the zone-1- or zone-2-like regions (Fig. 4b, top right panels). The Wnt/β-catenin pathway regulates CYP2E1 transcrip-tion, and the results showed that CYP2E1 expression was coordinately regulated by the increase of activeβ-catenin. APAP induces apoptotic cell death in hepatocytes through a signaling cascade characterized by an increase in
mitochondrial dysfunction, AIF (apoptosis-inducing fac-tor) release and PARP (poly (ADP-ribose) polymerase)
cleavage [30]. Using the 3D hepatic zonal channel, we
confirmed that APAP induced apoptotic cell death by increasing AIF expression and PARP cleavage in the
zone-3-like region, where nonphosphorylated β-catenin
and CYP2E1 levels were increased (Fig.4b, lower panels). Thus, the 3D hepatic zonal channel model was efficiently used for imaging and molecular experiments to evaluate zonal hepatotoxicity.
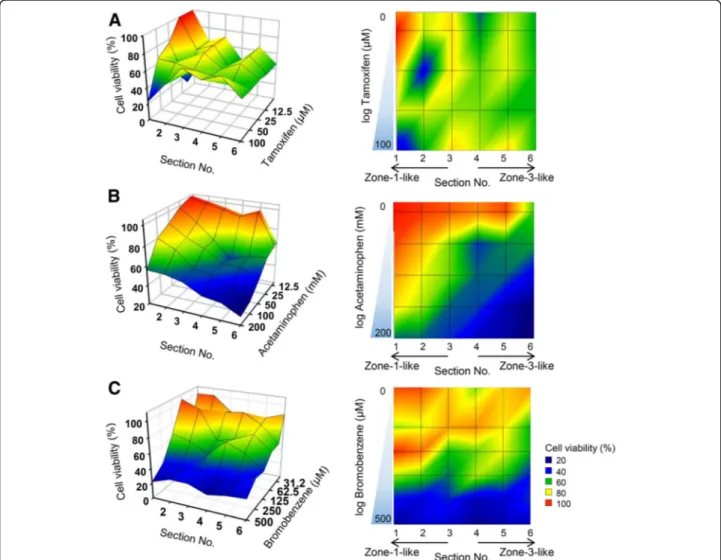
Furthermore, we examined the applicability of the 3D hepatic zonal channel model in screening assays, prefer-ably high-throughput screening of zonal hepatotoxicity. Three different hepatotoxic drugs, tamoxifen, bromo-benzene, and APAP, were applied to this system. The 3D hepatic zonal channel with a CHIR gradient was divided into six sections according to the distance guide and was
Fig. 4 Evaluation of the in vitro zonal hepatotoxicity using the 3D hepatic zonation model. a Application of the 3D hepatic zonation model using imaging analysis after APAP treatment. The intact 3D HepaRG sample in the agarose hydrogel channel was removed from the polyolefin tube and then treated with 10 mM APAP for 2 days in a multi-well plate. Quantitative analysis of 3D hepatic zonal channels was performed using staining with dual live/dead dyes as well as CHIR for diffusion of CHIR, CellTracker Deep Red Dye for cellular distribution, and EthD-1 for membrane-damaged cytotoxic cells, and the ChemiDoc XRS+ Imaging System, and images were visualized and analysed with MATLAB. The red and blue colours indicate high and low intensity of the dyes, respectively. The relative concentration was quantified and plotted for the control and APAP-treated groups. The EthD-1+-damaged cells were predominantly observed in the high CHIR concentration region in response to 10 mM APAP treatment. b Molecular experimental approaches using the 3D hepatic zonation model. The 3D HepaRG sample was removed from the 3D hepatic zonal channel and then divided into 3 pieces corresponding to zone-1-like, zone-2-like and zone-3-like regions according to the guide. After treatment with 10 mM APAP for 2 days, total protein was extracted from the 3D HepaRG and western blot analysis was performed. The expression ofβ-catenin, CYP2E1, AIF, and cleaved PARP was analysed, and β-actin was used as an internal control
treated with various concentrations of hepatotoxic drugs for 3 days. The viability of 3D HepaRG cells in each zonal section was evaluated using the CCK-8 assay. The relative cell viability was analysed according to the con-centrations of each hepatotoxic drug and zonal sections
using the MATLAB program (Fig. 5). These results
showed that tamoxifen caused toxicity in 3D HepaRG cells in all sections, regardless of zonal specificity (Fig.
5a). However, the APAP treatment led to a remarkably
different pattern of cell viability according to the dis-tance and APAP concentration. The 3D HepaRG cells tended to be more vulnerable to the effects of APAP when they were located closer to the zone-3-like section (high CHIR concentration region) (Fig. 5b). In addition, the profile of cell viability after bromobenzene treatment
was similar to that of APAP (Fig. 5c). However, 3D
HepaRG cells in the hepatic zonal channel model were more susceptible to treatment with APAP than
bromo-benzene. Under 100μM bromobenzene, 3D HepaRG
cells experienced greater cytotoxic effects in zone-3-like sections than in zone-1-like sections, but there were similar cytotoxic effects at high bromobenzene
concen-trations over 100μM. These results indicated that
hepatotoxic drugs causing zonal hepatotoxicity can be efficiently screened and can be classified as zone-specific hepatotoxic drugs by our 3D hepatic zonal channel model.
Discussion
Identifying potential hepatotoxic chemicals is a challen-ging task. Hepatotoxicity is one of the most critical findings that necessitates further investigations of new
Fig. 5 Imaging profiles of zonal hepatotoxicity using the 3D hepatic zonal channel model. Three different hepatotoxic drugs, tamoxifen (a), APAP (b), and bromobenzene (c), were administered to the sectioned 3D HepaRG sample with an CHIR gradient for 2 days, and cell viability was then evaluated as described in the Materials and Methods section. The values of the x-, y- and z-axes indicate the section number (from 1 to 6), cell viability, and drug concentration, respectively. The imaging profiles display the relative cell viability according to the colour legend. The red and blue colours indicate higher and lower cell viability, respectively
drugs in clinical trials [31]. Although animal studies are mandatory in nonclinical studies, a retrospective analysis revealed that animals do not precisely predict hepatotox-icity in humans, with only approximately 45–55% of predictions identified as correct [32]. Hepatotoxicity is mostly linked to drug metabolism in the liver, and the low concordance of hepatotoxicity can be caused by the difference in drug metabolism or hepatic physiology
between animals and humans [33,34]. Although human
primary hepatocytes and HepaRG cells exhibiting drug-metabolizing functions have been mostly used in nonclinical studies [10, 35], hepatic zonation showing different drug-metabolizing activities is another hurdle in predicting hepatotoxicity. Hepatic functional markers, such as albumin and transferrin, are widely expressed across the hepatic lobule without zonal specificity, while zonal dependence occurs for drug metabolism as well as
glutamine and glucose metabolism [36]. The
heteroge-neous activities of drug-metabolizing enzymes depend-ing on the zonal location can cause different adverse effects on hepatic lobules, and the evaluation of zonal hepatotoxicity is a considerable challenge. In nonclinical studies, human primary hepatocytes are considered the gold standard model for evaluating drug metabolism, but these cells exhibit severe limitations in terms of interdonor variability, functional instability and propaga-tion of long-term cultures [37]. In the present study, we used metabolically competent HepaRG cells, which have been used as a complement to primary hepatocytes to generate the hepatic zonal system and retain hepatic functions, such as CYP enzymatic activity, albumin/ transferrin production, and glutamine/glucose
metabol-ism [38]. We generated a gradient of CYP enzymes in
functional HepaRG cells by modulating Wnt/β-catenin signaling to mimic the zonation dependence of drug metabolism, and this system classified hepatotoxic drugs that exhibit zonal toxicity.
To date, a few trials have generated liver zonation in vitro using a bioreactor or a microfluidics system by regulating oxygen, exogenous hormones or chemicals, but these factors could not implement zonation for drug metabolism [13, 14]. The hepatic artery is located near the portal vein, and when the blood flows from the por-tal vein (zone-1) to the central vein (zone-3), an oxygen gradient can be generated across the hepatic lobule, and oxygen-enriched blood can induce oxidative stress in zone-1 [18]. Although oxidative stress conditions slightly decreased CYP activity, the change was not sufficient to generate a gradient of CYP enzymes. We have also eval-uated the CYP activity in HepaRG cells by adding H2O2,
an inducer of oxidative stress, at concentrations up to
200μM, which are not cytotoxic to HepaRG cells
(Add-itional file 5: Figure S5A). The fully differentiated
HepaRG cells were treated with H2O2and the enzymatic
activities of CYP1A2 and CYP3A4 were significantly
de-creased in HepaRG cells following exposure to H2O2
(Additional file 5: Figure S5B). However, no significant differences in the cytotoxic effects of the four hepato-toxic drugs were observed on HepaRG cells subjected to pretreatment with or without H2O2 (Additional file 5:
Figure S5C). Thus, H2O2 might mimic the oxidative
stress conditions in the pericentral region (zone-1) showing the low activity of CYPs, but H2O2does not
ap-pear to play key roles in mimicking the zonal toxicity in vitro regarding drug metabolism.
Apart from oxygen, McCarty et al. reported microflui-dics systems that generate a zonal function of glycogen uptake and urea formation with an insulin/glucagon mixture, but there were limitations in maintaining hep-atic function with drug metabolism capacity over time in the microfluidics platforms [13]. Although human primary hepatocytes are comparably active in drug metabolism, their activities rapidly decrease in monolayer cultures over time, and the activities of drug-metabolizing enzymes are difficult to maintain in vitro [39]. Since 3D cultures permit hepatocytes to maintain more functionality during long-term cultivation than monolayer cultures, we cultured metabolically competent HepaRG cells in a 3D structure by encapsulating them in agarose hydrogels, which main-tain the cellular phenotypes with higher cell viability and drug metabolism activity than monolayer cultures [40]. In the case of HepaRG cells, higher expression of functional markers, such as albumin, has been observed in 3D cul-tures, including spheroid and scaffold models, compared with 2D cultures [11,28]. In the 3D hepatic zonal channel reported in the present study, the agarose hydrogel had a high mechanical strength, allowing the channel to main-tain a stable shape and to be divided into small pieces for analyses of biosamples, implying that our 3D hepatic zonal system may be suitable for screening subacute responses to hepatotoxic drugs that occur over several days in vivo with hepatic zonation.
As shown in the present study, the 3D hepatic zonal channel screened the zonal hepatotoxic drugs APAP and bromobenzene and the nonzonal hepatotoxic drug tamoxifen. In particular, this system identified the zonal hepatotoxic drugs that were metabolized by CYP1A2, CYP2E1, and CYP3A4, which are zone-3 specific CYPs. Meanwhile, in Fig. 2, the cytotoxic effects of tamoxifen and isoniazid, CYP3A4-mediated hepatotoxic drugs, were not different between the HepaRG cells treated with and without CHIR, although we confirmed that CHIR increased the CYP3A4 activity. CYP3A4 is the main drug-metabolizing enzyme for tamoxifen but CYP2D6 and CYP2C19 are also involved in metabolizing this drug into the reactive 4-hydroxy metabolite [41]. Isoniazid is also metabolized by CYP2C9/2C19, CYP2D6,
3D hepatic zonal channel might be limited to screening zonal hepatotoxicity in vitro for drugs that are metabo-lized through the complex interactions of drug metaboliz-ing enzymes.
The 3D hepatic zonal system strongly supports the concept of generating hepatic zonation by modulating Wnt/β-catenin signaling. Several hypotheses about the mechanisms underlying liver zonation have been sug-gested, and Wnt/β-catenin signaling is an important driver of drug metabolism [7]. Mouse liver displayed a
distribution of β-catenin in the perivenous region, and
the localization of β-catenin is tightly regulated by ca-nonical Wnt pathways [43]. Following the loss of expres-sion of CYP enzymes, particularly Cyp2e1 and Cyp1a2,
in Ctnnb1 knockout mice [44], Wnt/β-catenin signaling
controls the expression of CYP enzymes. Despite the findings concerning the association of Wnt/β-catenin signaling with drug metabolism, the in vitro zonal model generated by modulating Wnt signaling had not been developed because the drug-metabolizing activities of hepatocytes are vulnerable to culture conditions, and thus a gradient of CYP enzymes is difficult to generate in vitro. In the present study, the expression of AXIN2, a β-catenin target gene, was increased in a dose-dependent manner in CHIR-treated HepaRG cells with a functional Wnt/β-catenin signaling pathway. CHIR is generally used to activate the Wnt/β-catenin signaling pathway by inhi-biting the GSK3β, which phosphorylates β-catenin and
induces its proteosomal degradation [22]. However,
Gerbal-Chaloin et al. reported that the expression of CYP2E1 and CYP1A2, but not CYP3A4, is regulated by Wnt/β-catenin signaling [25]. According to Briolotti et al., CHIR also activates the AhR (aryl hydrocarbon receptor) and PXR (pregnane X receptors) signaling pathways, as a partial agonist of AhR and PXR [45], as well as the Wnt/ β-catenin pathway. In the 3D hepatic zonal channel, we postulated that CYP2E1 and CYP1A were activated by
CHIR in a Wnt/β-catenin-dependent manner, but
CYP3A4 might be activated in a Wnt/
β-catenin-indepen-dent manner through cross-talk with AhR or PXR signal-ing. The more precise mechanisms by which CHIR alters drug metabolism in the 3D hepatic zonal channel require further investigation.
Human stem cell-derived hepatocytes, hepatic orga-noids or 3D spheroid models have been suggested as alternative hepatic models to mimic the hepatic physi-ology in humans and enable a more precise prediction of hepatotoxicity in vivo. However, these models exhibit homogenous drug metabolism activities without zonal specificity and are not efficient at screening zonal
hep-atotoxic compounds [46, 47]. The proposed 3D hepatic
zonal systems enable the use of high-throughput approaches to screen and classify zonal hepatotoxic drugs through a direct imaging analysis. This system also
provides molecular insights into the response of the recovered zone-specific hepatocytes to zonal hepatotox-icity. The zonal hepatotoxic profiles showing the re-sponse of compounds to drug-metabolizing enzymes are essential for developing an in silico model of hepatotox-icity. Furthermore, the zonal function of drug metabol-ism was generated by CHIR, and the defined condition can be used to generate additional hepatic zonal models by applying the system to human stem cell- and induced pluripotent stem cell-derived hepatocytes or hepatic organoid models. These approaches will further lead to risk assessments for personalized toxicology accounting for the heterogeneity of drug metabolism.
Conclusions
In the present study, we generated a 3D hepatic zonal
system by modulating Wnt/β-catenin signaling. Although
a few in vitro models mimicking liver zonation have been reported, limitations regarding the implementation of hepatic zonation to assess drug metabolism remain. This system provides a simple and robust method to generate the zonal distribution of drug metabolism and permit screens of zonal hepatotoxic drugs and subacute toxicity over several days. The zonal toxicity profiles provide infor-mation that addresses the conflicting data on
heteroge-neous drug metabolism and clarifies the spatial
heterogeneity of toxicological responses. This information should be helpful for developing predictive models of hep-atotoxicity and for decision-making in drug development processes.
Methods
Cells and chemicals
Undifferentiated human HepaRG cells (HPR101) were purchased from Biopredic International (Rennes, France) and human normal immortalized THLE2 and hepatoma Huh7 cells were obtained from American Type Culture Collection. William’s E medium with no glutamine, bronchial epithelium growth medium (BEGM) medium with complete supplement, Dulbecco’s modified Eagle medium (DMEM), fetal bovine serum (FBS), fibronectin, phosphate buffered saline (PBS), L-glutamine, penicillin/ streptomycin, and trypsin-EDTA were purchased from Thermo Fisher Scientific (Rockford, IL, USA). Collagen type I was purchased from Advanced Biomatrix (San Diego, CA, USA). Insulin, hydrocortisone hemisuccinate, dimethyl sulfoxide (DMSO), methanol, acetonitrile
anhyd-rous, CHIR, 30% wt H2O2 solution, and agarose (low
gelling temperature) were purchased from Sigma-Aldrich (St. Louis, MO, USA). Chlorzoxazone, tamoxifen, isonia-zid, bromobenzene, and APAP were acquired from Sigma-Aldrich (USA).
Cell culture
The undifferentiated human HepaRG cells were cultured in Williams’ E medium containing 10% serum, 1% L-glutamine, 1% penicillin/streptomycin, 5μg mL− 1 in-sulin, and 50μM hydrocortisone. The cells were cultured on 150 cm2T-flask culture plates at 37 °C, 5% CO2, and
100% humidity for 2 weeks, and the medium was chan-ged every 2–3 days. After 2 weeks, the culture medium was replaced with culture medium containing 2% DMSO to activate differentiation. The culture medium with 2% DMSO was renewed every 2–3 days. After 2 weeks, the differentiated cells were washed with PBS two times and rinsed with trypsin-EDTA for 1 min. Then, the cells were obtained with trypsin-EDTA. THLE2 cells were cultured in complete BEGM medium on the collagen/fibronectin coated plate and Huh7 cells were maintained in DMEM, supplemented with 10% heat-inactivated FBS and 1% penicillin/streptomycin.
Cell viability assay and CYP activity measurement
Differentiated cells were seeded in a 96-well clear bottom plate at a density of 100,000 viable cells per well. HepaRG cells were cultured for another 7 days to ensure the complete differentiation of the monolayer, according the manufacturer’s instructions. After 7 days, the differ-entiation medium was replaced with culture medium containing 0.1% DMSO to reduce the basal CYP levels. After 3 days, each group of HepaRG cells was exposed
to various concentrations of CHIR (control, 3μM, 6 μM,
or 9μM), and the medium with the concentrated
chemi-cals was replaced every 3 days. At certain times (day 1, 3, 6, or 10), Cell Counting Kit-9 (CCK-8) assays (Dojindo, Japan) and P450-Glo CYP assays (Promega, WI, USA) were performed according to the manufacturer’s instruc-tions after two washes with PBS. The CYP activity re-sults were normalized to the cell number by dividing the P450-Glo luminescence values by the CCK-8 absorbance values. CYP2E1 enzyme activity was evaluated after CHIR treatment. Because there is no commercially avail-able CYP2E1 measurement kit, CYP2E1 activity was evaluated by measuring the transformation of chlorzoxa-zone to the 6-hydroxychlorzoxachlorzoxa-zone metabolite. The dif-ferentiated HepaRG cells were cultured on 6-well plates in growth medium containing 0.1% DMSO to decrease the basal CYP level. The CYP2E1 activity assay was
performed on day 3. After medium removal, 500μL of
300μM chlorzoxazone in growth medium containing
0.1% DMSO was added and kept in the incubator for 6
h. A total of 400μL of the solution was collected and
diluted (1:1) with acetonitrile with an internal standard for the conversion reaction. 6-Hydroxychlorzoxazone was assessed by HPLC tandem mass spectrometry. The system consisted of an AB Sciex Qtrap 4000 (AB Sciex, Foster City, CA, USA) mass spectrometer interfaced
with an Agilent 1200 series HPLC system (Agilent Tech-nologies, Palo Alto, CA, USA). Chromatography was
performed at 35 °C with a 5μL injection volume using a
Knetex C18 column (50 mm × 2.1 mm, 5μm particle
size; Phenomenex, Torrance CA, USA) at a flow rate of
0.3 mL min− 1. The two mobile phases were 0.1% formic
acid in ultrapure water and acetonitrile.
Quantitative RT-PCR (qRT-PCR) and microarray analysis Fully differentiated HepaRG cells cultured on the 12-well collagen-coated culture plate in the 0.1% DMSO culture medium at least 3 days, THLE2, and Huh7 cells
were treated with CHIR (control, 3μM, 6 μM, 9 μM) for
3 days. Following incubation, RNA samples were ex-tracted by a Maxwell 16 system for RT-PCR. We used BLAST to design primer sequences and purchased the sequences from Macrogen (Seoul, Korea). The sequences of the primers are presented in Additional file 6: Table S1, and 18S rRNA was used as an internal control. One-step reverse transcription was performed using a Power SYBR Green RNA-to CT 1-Step kit according to the manufacturer’s instructions.
For the microarray analysis, HepaRG cells treated with
0.1% DMSO and 9μM CHIR for 3 days were purified
using an RNeasy mini kit (Qiagen, Valencia, CA, USA). An Agilent Human GE 4 K microarray was used for this experiment (Agilent Technologies, USA). The synthesis of target cRNA probes and the hybridization were per-formed using Agilent’s Low RNA Input Linear Amplifi-cation Kit (Agilent Technologies, USA) according to the manufacturer’s instructions and as described previously [48,49]. Briefly, 1μg of total RNA was used and amplified, and labelled cRNA was purified on the cRNA Cleanup Module (Agilent Technologies, USA). The labelled cRNA target was quantified using an ND-1000 spectrophotom-eter (NanoDrop Technologies, Wilmington, DE, USA). After checking the labelling efficiency, fragmented cRNA was hybridized into Agilent’s arrays at 65 °C for 17 h using an Agilent Hybridization oven (Agilent Technologies, USA). The hybridized arrays were washed according to
the manufacturer’s washing protocol (Agilent
Technolo-gies, USA). Preprocessing and data normalization were performed using Agilent’s GeneSpring GX. DEGs with at least 2-fold changes and statistically significant differences in expression (P < 0.01) compared with that of the controls were selected. Gene function was analysed using Ingenuity Pathways Analysis (IPA) software (Qiagen, USA). The stat-istical significance of canonical pathways was calculated by a right-tailed Fisher’s exact test.
Cell viability assay
All stock solutions of the drug were prepared in DMSO. The differentiated HepaRG cells were prepared in 96-well plates containing growth medium with 0.1%
DMSO for at least 3 days. The cells were treated with
growth media containing 0.1% DMSO or 9μM CHIR.
After 3 days, the cells were washed with PBS and imme-diately exposed to two-fold diluted concentrations of
tamoxifen (200μM), bromobenzene (50 μM), isoniazid
(200μM), or APAP (20 mM) for 2 days on culture days.
After washing with PBS, cell viability was assessed using a CCK-8 assay according to the manufacturer’s protocol. The absorbance was measured using a Promega GloMax luminometer (Mannheim, Germany). The dose-response curves were analysed based on nonlinear regression by four-parameter equations, and the 50% inhibitory
con-centration (IC50) was calculated using GraphPad Prism
software (GraphPad, San Diego, CA, USA). Fabrication of the 3D hepatic zonal channel
Twenty milligrams of agarose, low melting temperature, was dissolved in 1 mL of Williams’ E medium containing 2% L-glutamine, 2% penicillin/streptomycin, 10μg mL− 1
insulin, and 100μM hydrocortisone at 90 °C for 2 h.
Additionally, the differentiated cells that had been cultured in growth medium with a low concentration of DMSO for 3 days were obtained with trypsin-EDTA. A total of 500μL of a 100,000 cells per mL suspension was mixed with an agarose solution, which was slightly cooled before use, in the ratio of one to one (final
concentration of agarose gel: 1%). A total of 360μL of
the cell suspension was quickly injected into the 5 mm diameter and 9 cm long polyolefin tube with a 3D printed guide, which can help to divide the sample into 3 or 6 parts after cultivation. The tube and its guide were placed in an incubator for 1 h for gelation. To gen-erate diffusion of CHIR, growth medium containing 0.1% DMSO was injected into the left side of the tube
(Inlet 1), 9μM CHIR in growth medium containing 0.1%
DMSO was injected into the right side of the tube (Inlet 2) by a 1 mL syringe, and the media were renewed every
day. As shown in Fig. 3b, the diffusion of CHIR was
tracked for up to 15 days by the ChemiDoc XRS+ Im-aging System (Bio-Rad, Hercules, CA, USA) after the gel was extracted from the tube. The relative concentrations of CHIR and the linear diffusion were calculated based on the saturated maximum intensity. The intensity along the cross-section of the hydrogel after tube removal was obtained using MATLAB software (MathWorks, Natick, MA, USA). On day 7, when the diffusion profiles showed linearity, the hydrogel containing cells and mimicking a zone-specific microenvironment was extracted from the tube for image analysis and sliced into 3 or 6 parts along the guide for western blotting or drug screening.
Confocal imaging analysis
The 3D HepaRG cells were extracted from the 3D hepatic zonal channel on day 3, 6, and 11. Cell viability of 3D
HepaRG cells was also evaluated by calcein-acetoxymethyl
(Calcein-AM) and ethidium homodimer-1 (Ethd-1)
dual-staining assays. The dye solution was aspirated, and the cells were incubated for 1 h. The green fluorescence (excitation/emission wavelengths: 494/517 nm) and the red fluorescence (excitation/emission wavelengths: 528/ 617 nm) were monitored using a confocal microscope (LSM 800 with Airyscan; Zeiss, Jena, Germany) as de-scribed previously [50]. To determine the 3D morphology of HepaRG cells in the hydrogel matrix, a series of z-stack
confocal microscopy images covering a 190μM depth of
the hydrogel fractions was projected in perspective view. Image analysis of zonal hepatotoxicity using the 3D hepatic zonal channel
To monitor the 3D distribution of HepaRG cells encap-sulated in an agarose hydrogel, CellTracker™ Deep Red probes were loaded into the HepaRG cells according to the manufacturer’s instructions. After the dyeing step, the 3D hepatic zonal channel was prepared as described above. After 7 days of CHIR diffusion, the 3D hepatic zonal channel was removed from the tube by gentle air blowing with a 1 mL pipette without slicing and immedi-ately soaked in 2 mL of serum-free media without APAP or with 10 mM APAP for 2 days in a 6-well plate. After two washes with PBS, the treated 3D hepatic zonal
chan-nels were stained with 2μM EthD-1, an indicator of the
membrane-damaged cells, to indicate cell death by the hepatotoxic drug. Image analysis was performed by the ChemiDoc system after two washes with PBS (Cell-Tracker™ Deep Red; 695/55 filter/red epi-illumination, CHIR; standard filter/UV transillumination, EthD-1; 605/50 filter/green epi-illumination). The intensity along the cross-section of the 3D hepatic zonal channel after tube removal was obtained using MATLAB software as explained above.
Protein extraction from the hepatic zonal channel and western blot analysis
3D hepatic zonal strips treated by APAP were sliced into 3 pieces as zone-1-, zone-2- and zone-3-like sections. The average weight of a piece of the channel was
ap-proximately 90 mg. We added 40μL of 5× RIPA buffer,
45μL of 4× Laemmli sample buffer and 5 μL of
mercaptoethanol immediately. The sample was heated on a 90 °C block at 500 rpm for 10 min and then in-stantly moved to a 42 °C heat block. Two units of
thermostable β-agarase (Nippon Gene, Japan) in
buff-ered aqueous glycerol solution was added for 10 min to dissolve the agarose matrix and kept for another 10 min to degrade agarose in the strip. Cell debris and unde-graded agarose were removed by centrifugation at 120,000 rpm for 10 min. Protein quantification was
antibody (sc-47,778, Santa Cruz, TX, USA) after the
pri-mary western blot analysis. Then, 30μL of the
super-natant was loaded with equal amounts of the solution (40μL) in the wells in an acrylamide gel along with mo-lecular weight markers, and gel electrophoresis was per-formed at 80 V for 2 h. The transfer process was then performed at 100 V for 1.5 h. The protein-transferred membranes were blocked in 5% skim milk in Tween Tris-buffered saline (TTBS) at room temperature for 1 h. Non-phoso-β-catenin, CYP2E1, apoptosis-inducing factor (AIF), and poly ADP ribose polymerase (PARP) were used to detect the protein profile in the secondary western blot with quantified samples and incubated overnight in the solution with primary antibody against the target protein after three washes with Tris-buffered saline (TBS). The information of the antibodies are pre-sented in Additional file 7: Table S2. After incubation, the secondary antibodies were conjugated to the primary antibody for detection. Finally, the Clarity™ Western ECL Substrate was used for detection.
In vitro zonal hepatotoxicity screening using the 3D hepatic zonal channel
After 7 days of CHIR diffusion, the tube and hydrogel were sliced into 6 sections at the same time, and the sec-tion closest to the CHIR source was labelled secsec-tion No. 6, with the numbers for the other sections decreasing in order by location. The CHIR-gradient 3D HepaRG cells were treated with two-fold diluted concentrations of
tamoxifen (0–100 μM), APAP (0–200 mM), and
bromo-benzene (0–500 μM) for 48 h at 37 °C and 5% CO2. After
washing with PBS, cell viability was measured using a
CCK-8 assay according to the manufacturer’s protocol.
The absorbance at 450 nm was measured using a Pro-mega GloMax luminometer (Mannheim, Germany). Cell viability was calculated as the percentage of viable cells relative to the untreated controls. The patterns of zonal hepatotoxicity are presented based on relative cell viabil-ity using the MATLAB software as described above. Statistical analysis
All data are presented as the means ± SD for cell viability, mRNA levels, and enzymatic activity of CYPs. Statistically significant differences between groups were analyzed using Student’s t-test with GraphPad Prism software (GraphPad, USA).P < 0.05 indicated a statistically signifi-cant difference between groups.
Additional files
Additional file 1:Figure S1. Viability of monolayer-cultured HepaRG cells after CHIR treatment (days 1, 3, 6, and 10). (A) Cell viability was evaluated using CCK-8 assays on days 1, 3, 6, and 10 after the CHIR treatment. (B) HepaRG cells was observed before and after 3 days of CHIR treatment under
a phase-contrast microscope (scale bar, 100μm). The microscopic observation showed that fully differentiated HepaRG cells were organized in small clusters and displayed a typical hepatocytes-like morphology. (TIF 2598 kb)
Additional file 2:Figure S2. qRT-PCR of CYP enzymes in various hepatocyte cell lines after CHIR treatment. The hepatocytes, including THLE2 (A) and Huh7 (B) were treated with CHIR for 3 days. The expression levels of zone-3-specific CYPs, such asCYP2E1 and CYP3A4, were evaluated by qRT-PCR. (TIF 532 kb)
Additional file 3:Figure S3. Histopathologic observation of liver from rats treated with hepatotoxic drugs. The light microscopic image of the tamoxifen-, isoniazid-, bromobenzene-, and APAP-treated liver was obtained from the Open TG-GATEs database. The Sprague-Dawley rats were orally administered each drug for 29 days; tamoxifen, 20 mg/kg; isoniazid, 200 mg/kg; bromobenzene, 100 mg/kg; and APAP, 1000 mg/kg. The yellow, green, and blue arrows indicate the increased centrilobular mitosis, hepatocellular necrosis and inflammatory cell infiltration, respectively. The yellow circle indicates hepatic cellular damage around the central vein. Scale bar, 100μm. (TIFF 17697 kb)
Additional file 4:Figure S4. Confocal image of 3D HepaRG cells in the agarose hydrogel channel. (A) Agarose hydrogel gel containing HepaRG cells extracted from the polyolefin tube after 1 day of incubation. The cells in the gel were dyed with Calcein-AM (live, green) and EthD-1 (dead, red) and observed by confocal microscopy in the top, cross-section, and side views. Scale bar, 2 mm. (B) Cell viability of HepaRG cells on the monolayer (2D) and agarose hydrogel gel (3D) was measured by the CCK-8 assay after 1 day of incubation. (C) 3D HepaRG spheroids obtained by long-term cultivation (days 3, 6, and 11) in the agarose hydrogel gel from the polyolefin tube. Scale bar, 100μm. (TIFF 7361 kb)
Additional file 5:Figure S5. Effects of H2O2on zonal toxicity in
HepaRG cells. Effects of H2O2on cell viability, levels of CYP mRNAs,
enzymatic activities of CYPs, and cytotoxicity of hepatotoxic drugs were evaluated using the same procedures performed in the CHIR-treated group. (A) Fully differentiated HepaRG cells were exposed to various concentrations of H2O2for 10 days and the medium with the concentrated
chemicals was replaced every 3 days. Cell viability was evaluated using CCK-8 assays after two washes with PBS. No change in the cross-reaction between H2O2and the CCK-8 reagent was observed in the background values
of controls. Levels of CYP mRNAs (CYP2B6, CYP1A2, CYP2E1, and CYP3A4) were analyzed in cells treated with H2O2for 3 days using
qRT-PCR. (B) The activities of CYP1A2 and CYP3A4 were measured using the P450-Glo CYP assay, and CYP2E1 activity was measured using HPLC-tandem mass spectrometry.*P < 0.05. (C) The hepatotoxic drugs tamoxifen, isoniazid, bromobenzene, and APAP were administered to HepaRG cells that had been pretreated with 200μM H2O2for 3 days. The
viability of HepaRG cells was measured using the CCK-8 assay, and the dose-response curve was analyzed using GraphPad Prism software. (TIF 959 kb)
Additional file 6:Table S1. List of the primers used in this study. (DOCX 19 kb)
Additional file 7:Table S2. List of antibodies used in this study. (DOCX 13 kb)
Abbreviation
3D:three dimensional; AhR: Aryl hydrocarbon receptor; AIF: apoptosis inducing factor; APAP: acetaminophen; CCK-8: Cell Counting Kit-9; CHIR: CHIR99021; CYP: cytochrome P450; DEGs: differentially expressed genes; DMSO: dimethyl sulfoxide; GSK3β: glycogen synthase kinase-3; PARP: poly (ADP-ribose) polymerase; PBS: phosphate buffered saline; PXR: Pregnane X receptors; TBS: Tris-buffered saline
Acknowledgements Not applicable.
Funding
This work was supported by a National Research Foundation of Korea (NRF) grant funded by the Ministry of Education (2017R1D1A1B03035898), the Ministry of Science and ICT (2016M3A9C4953144,
NRF-2014M3A7B6020163, and NRF-2018M3A9H3023077), and a grant from the Technology Innovation Program (No. 10063334) funded by the Ministry of
Trade, Industry & Energy (MI, Korea). The funders had no role in the study design, data collection or analysis, decision to publish, or preparation of the manuscript.
Availability of data and materials
All data generated or analysed during this study are included in this published article and its additional files.
Authors’ contributions
JA designed the studies, performed the experiments, analysed the data and prepared the manuscript. JHA performed the western blot experiments. SY and YSN planned the project and prepared the manuscript. JHO and MYS wrote and critically revised the manuscript. All authors read and approved the final manuscript.
Ethics approval and consent to participate Not applicable.
Consent for publication Not applicable.
Competing interests
The authors declare that they have no competing interests.
Publisher’s Note
Springer Nature remains neutral with regard to jurisdictional claims in published maps and institutional affiliations.
Author details
1Department of Material Science and Engineering, Korea Advanced Institute
of Science and Technology (KAIST), Daejeon 34141, Republic of Korea.
2Department of Predictive Toxicology, Korea Institute of Toxicology (KIT),
Daejeon 34114, Republic of Korea.3Stem Cell Research Center, Korea Research Institute of Bioscience and Biotechnology (KRIBB), Daejeon 34141, Republic of Korea.4Department of Functional Genomics, KRIBB School of Bioscience, Korea University of Science and Technology (UST), Daejeon 34113, Republic of Korea.
Received: 3 December 2018 Accepted: 11 February 2019
References
1. Rappaport AM, Borowy ZJ, Lougheed WM, Lotto WN. Subdivision of hexagonal liver lobules into a structural and functional unit; role in hepatic physiology and pathology. Anat Rec. 1954;119(1):11–33.
2. Jungermann K, Kietzmann T. Zonation of parenchymal and nonparenchymal metabolism in liver. Annu Rev Nutr. 1996;16:179–203. 3. Torre C, Perret C, Colnot S. Molecular determinants of liver zonation. Prog
Mol Biol Transl Sci. 2010;97:127–50.
4. Jungermann K, Kietzmann T. Oxygen: modulator of metabolic zonation and disease of the liver. Hepatology. 2000;31(2):255–60.
5. Gebhardt R. Metabolic zonation of the liver: regulation and implications for liver function. Pharmacol Ther. 1992;53(3):275–354.
6. Rappaport AM. The microcirculatory acinar concept of normal and pathological hepatic structure. Beitrage zur Pathologie. 1976;157(3):215–43. 7. Gebhardt R, Baldysiak-Figiel A, Krugel V, Ueberham E, Gaunitz F.
Hepatocellular expression of glutamine synthetase: an indicator of morphogen actions as master regulators of zonation in adult liver. Prog Histochem Cytochem. 2007;41(4):201–66.
8. Jungermann K. Metabolic zonation of liver parenchyma. Semin Liver Dis. 1988;8(4):329–41.
9. Allen JW, Khetani SR, Bhatia SN.In vitro zonation and toxicity in a hepatocyte bioreactor. Toxicol Sci. 2005;84(1):110–9.
10. Guillouzo A, Corlu A, Aninat C, Glaise D, Morel F, Guguen-Guillouzo C. The human hepatoma HepaRG cells: a highly differentiated model for studies of liver metabolism and toxicity of xenobiotics. Chem Biol Interact. 2007;168(1):66–73.
11. Gunness P, Mueller D, Shevchenko V, Heinzle E, Ingelman-Sundberg M, Noor F. 3D organotypic cultures of human HepaRG cells: a tool forin vitro toxicity studies. Toxicol Sci. 2013;133(1):67–78.
12. Hewitt NJ, Lechon MJ, Houston JB, Hallifax D, Brown HS, Maurel P, et al. Primary hepatocytes: current understanding of the regulation of metabolic enzymes and transporter proteins, and pharmaceutical practice for the use of hepatocytes in metabolism, enzyme induction, transporter, clearance, and hepatotoxicity studies. Drug Metab Rev. 2007;39(1):159–234. 13. McCarty WJ, Usta OB, Yarmush ML. A microfabricated platform for
generating physiologically-relevant hepatocyte zonation. Sci Rep. 2016; 6:26868.
14. Allen JW, Bhatia SN. Formation of steady-state oxygen gradientsin vitro: application to liver zonation. Biotechnol Bioeng. 2003;82(3):253–62. 15. Birchmeier W. Orchestrating Wnt signalling for metabolic liver zonation. Nat
Cell Biol. 2016;18(5):463–5.
16. Jungermann K, Kietzmann T. Role of oxygen in the zonation of carbohydrate metabolism and gene expression in liver. Kidney Int. 1997; 51(2):402–12.
17. McEnerney L, Duncan K, Bang BR, Elmasry S, Li M, Miki T, et al. Dual modulation of human hepatic zonation via canonical and non-canonical Wnt pathways. Exp Mol Med. 2017;49(12):e413.
18. Kietzmann T. Metabolic zonation of the liver: the oxygen gradient revisited. Redox Biol. 2017;11:622–30.
19. Kim W, Kim M, Jho EH. Wnt/beta-catenin signalling: from plasma membrane to nucleus. Biochem J. 2013;450(1):9–21.
20. Oinonen T, Lindros KO. Zonation of hepatic cytochrome P-450 expression and regulation. Biochem J. 1998;329(Pt 1):17–35.
21. Thomas M, Bayha C, Vetter S, Hofmann U, Schwarz M, Zanger UM, et al. Activating and inhibitory functions of WNT/beta-catenin in the induction of cytochromes P450 by nuclear receptors in HepaRG cells. Mol Pharmacol. 2015;87(6):1013–20.
22. Chen EY, DeRan MT, Ignatius MS, Grandinetti KB, Clagg R, McCarthy KM, et al. Glycogen synthase kinase 3 inhibitors induce the canonical WNT/beta-catenin pathway to suppress growth and self-renewal in embryonal rhabdomyosarcoma. Proc Natl Acad Sci U S A. 2014;111(14):5349–54. 23. Wang S, Ye L, Li M, Liu J, Jiang C, Hong H, et al. GSK-3β inhibitor
CHIR-99021 promotes proliferation through upregulatingβ-catenin in neonatal atrial human cardiomyocytes. J Cardiovasc Pharmacol. 2016;68(6):425–32. 24. Martin H, Sarsat JP, de Waziers I, Housset C, Balladur P, Beaune P, et al.
Induction of cytochrome P450 2B6 and 3A4 expression by phenobarbital and cyclophosphamide in cultured human liver slices. Pharm Res. 2003; 20(4):557–68.
25. Gerbal-Chaloin S, Dume AS, Briolotti P, Klieber S, Raulet E, Duret C, et al. The WNT/beta-catenin pathway is a transcriptional regulator of CYP2E1, CYP1A2, and aryl hydrocarbon receptor gene expression in primary human hepatocytes. Mol Pharmacol. 2014;86(6):624–34.
26. Lin RZ, Chang HY. Recent advances in three-dimensional multicellular spheroid culture for biomedical research. Biotechnology journal: healthcare nutrition. Technology. 2008;3(9–10):1172–84.
27. Gaskell H, Sharma P, Colley HE, Murdoch C, Williams DP, Webb SD. Characterization of a functional C3A liver spheroid model. Toxicol Res. 2016; 5(4):1053–65.
28. Malinen MM, Kanninen LK, Corlu A, Isoniemi HM, Lou Y-R, Yliperttula ML, et al. Differentiation of liver progenitor cell line to functional organotypic cultures in 3D nanofibrillar cellulose and hyaluronan-gelatin hydrogels. Biomaterials. 2014;35(19):5110–21.
29. Tran TB, Cho S, Min J. Hydrogel-based diffusion chip with electric cell-substrate impedance sensing (ECIS) integration for cell viability assay and drug toxicity screening. Biosens Bioelectron. 2013;50:453–9.
30. Jaeschke H, Xie Y, McGill MR. Acetaminophen-induced liver injury: from animal models to humans. J Clin Transl Hepatol. 2014;2(3):153. 31. Lee WM. Drug-induced hepatotoxicity. N Engl J Med. 2003;349(5):474–85. 32. Olson H, Betton G, Robinson D, Thomas K, Monro A, Kolaja G, et al.
Concordance of the toxicity of pharmaceuticals in humans and in animals. Regul Toxicol Pharmacol. 2000;32(1):56–67.
33. Baillie TA, Rettie AE. Role of biotransformation in drug-induced toxicity: influence of intra-and inter-species differences in drug metabolism. Drug Metab Pharmacokinet. 2011;26(1):15–29.
34. Peters TS. Do preclinical testing strategies help predict human hepatotoxic potentials? Toxicol Pathol. 2005;33(1):146–54.
35. Lübberstedt M, Müller-Vieira U, Mayer M, Biemel KM, Knöspel F, Knobeloch D, et al. HepaRG human hepatic cell line utility as a surrogate for primary human hepatocytes in drug metabolism assessmentin vitro. J Pharmacol Toxicol Methods. 2011;63(1):59–68.
36. Colnot S, Perret C. Liver zonation. Molecular pathology of liver diseases: Springer; 2011. p. 7–16.
37. Gerets H, Tilmant K, Gerin B, Chanteux H, Depelchin B, Dhalluin S, et al. Characterization of primary human hepatocytes, HepG2 cells, and HepaRG cells at the mRNA level and CYP activity in response to inducers and their predictivity for the detection of human hepatotoxins. Cell Biol Toxicol. 2012; 28(2):69–87.
38. Anthérieu S, Chesné C, Li R, Camus S, Lahoz A, Picazo L, et al. Stable expression, activity, and inducibility of cytochromes P450 in differentiated HepaRG cells. Drug Metab Dispos. 2010;38(3):516–25.
39. Wilkening S, Bader A. Influence of culture time on the expression of drug-metabolizing enzymes in primary human hepatocytes and hepatoma cell line HepG2. J Biochem Mol Toxicol. 2003;17(4):207–13.
40. Lee JS, Shin J, Park H-M, Kim Y-G, Kim B-G, Oh J-W, et al. Liver extracellular matrix providing dual functions of two-dimensional substrate coating and three-dimensional injectable hydrogel platform for liver tissue engineering. Biomacromolecules. 2013;15(1):206–18.
41. Wiseman H, Lewis DF. The metabolism of tamoxifen by human cytochromes P450 is rationalized by molecular modelling of the enzyme-substrate interactions: potential importance to its proposed anti-carcinogenic/carcinogenic actions; 1996.
42. Wang P, Pradhan K, X-b Z, Ma X. Isoniazid metabolism and hepatotoxicity. Acta Pharm Sin B. 2016;6(5):384–92.
43. Burke ZD, Tosh D. The Wnt/β-catenin pathway: master regulator of liver zonation? Bioessays. 2006;28(11):1072–7.
44. Benhamouche S, Decaens T, Godard C, Chambrey R, Rickman DS, Moinard C, et al. Apc tumor suppressor gene is the "zonation-keeper" of mouse liver. Dev Cell. 2006;10(6):759–70.
45. Briolotti P, Chaloin L, Balaguer P, Da Silva F, Tománková V, Pascussi J-M, et al. Analysis of glycogen synthase kinase inhibitors that regulate cytochrome P450 expression in primary human hepatocytes by activation ofβ-catenin, aryl hydrocarbon receptor and pregnane X receptor signaling. Toxicol Sci. 2015;148(1):261–75.
46. Ma X, Qu X, Zhu W, Li Y-S, Yuan S, Zhang H, et al. Deterministically patterned biomimetic human iPSC-derived hepatic model via rapid 3D bioprinting. Proc Natl Acad Sci. 2016;113(8):2206–11.
47. Pridgeon CS, Schlott C, Wong MW, Heringa MB, Heckel T, Leedale J, et al. Innovative organotypicin vitro models for safety assessment: aligning with regulatory requirements and understanding models of the heart, skin, and liver as paradigms. Arch Toxicol. 2018;92(2):557-69.
48. Jung KB, Lee H, Son YS, Lee MO, Kim YD, Oh SJ, et al. Interleukin-2 induces thein vitro maturation of human pluripotent stem cell-derived intestinal organoids. Nat Commun. 2018;9(1):3039.
49. Son MY, Sim H, Son YS, Jung KB, Lee MO, Oh JH, et al. Distinctive genomic signature of neural and intestinal organoids from familial Parkinson's disease patient-derived induced pluripotent stem cells. Neuropathol Appl Neurobiol. 2017;43(7):584–603.
50. Jung KB, Lee H, Son YS, Lee JH, Cho HS, Lee MO, et al.In vitro and in vivo imaging and tracking of intestinal organoids from human induced pluripotent stem cells. FASEB J. 2018;32(1):111–22.