저작자표시-비영리-변경금지 2.0 대한민국 이용자는 아래의 조건을 따르는 경우에 한하여 자유롭게 l 이 저작물을 복제, 배포, 전송, 전시, 공연 및 방송할 수 있습니다. 다음과 같은 조건을 따라야 합니다: l 귀하는, 이 저작물의 재이용이나 배포의 경우, 이 저작물에 적용된 이용허락조건 을 명확하게 나타내어야 합니다. l 저작권자로부터 별도의 허가를 받으면 이러한 조건들은 적용되지 않습니다. 저작권법에 따른 이용자의 권리는 위의 내용에 의하여 영향을 받지 않습니다. 이것은 이용허락규약(Legal Code)을 이해하기 쉽게 요약한 것입니다. Disclaimer 저작자표시. 귀하는 원저작자를 표시하여야 합니다. 비영리. 귀하는 이 저작물을 영리 목적으로 이용할 수 없습니다. 변경금지. 귀하는 이 저작물을 개작, 변형 또는 가공할 수 없습니다.
농학박사학위논문
Tandem Mass Spectrometry를 활용한
혈청, 소변, 양봉 시료 및 대표작물 중
다종농약다성분 동시분석
Simultaneous Analysis of Pesticide
Multiresidues in Human Serum, Urine,
Apiculture Samples, and Representative Crops
Using Tandem Mass Spectrometry
2018년 8월
서울대학교 대학원
농생명공학부 응용생명화학전공
신 용 호
A Dissertation for the Degree of Doctor of Philosophy
Simultaneous Analysis of Pesticide
Multiresidues in Human Serum, Urine,
Apiculture Samples, and Representative Crops
Using Tandem Mass Spectrometry
August 2018
Yongho Shin
Applied Life Chemistry Major
Department of Agricultural Biotechnology
Seoul National University
i
Abstract
Pesticides are used for the effective control of pests, microorganisms, and
weeds from crops and have contributed to food security. It is necessary to
determine as many pesticides as possible in human, the environment, and
agricultural products due to the intrinsic toxicity and ecotoxicity of pesticides.
In this study, a tandem mass spectrometry coupled to a gas chromatography
(GC-MS/MS) or liquid chromatography (LC-MS/MS) was utilized to
determine approximately four hundreds of pesticides in biological samples
(serum and urine), apiculture samples (bee, pollen, and honey), and
representative crops (pepper, orange, brown rice, and soybean). The scheduled
multiple reaction monitoring (MRM) of the tandem mass spectrometer was
employed in all methodologies to achieve rapid and simultaneous analysis and
to obtain optimal sensitivity and selectivity of target analytes. The preparation
methods for serum and urine were selected by comparing with the three
versions of “Quick, Easy, Cheap, Effective, Rugged, and Safe” (QuEChERS)
procedures. The optimized method was validated for 379 (serum) and 380
(urine) pesticides using LC-MS/MS. As a result, 94.5% (serum) and 95.8%
(urine) of the total pesticides satisfied a limit of quantitation of 10 ng/mL. The
established analytical method was applied to GC-MS/MS amenable pesticides
(54 for serum and 55 for urine) and 53 analytes showed a limit of quantitation
of 10 ng/mL. It was enough low sensitivity to determine pesticides in biological
samples for forensic, clinical, and occupational exposure application.
ii
honey were treated by optimized QuEChERS methods. Among the pesticide
multiresidues, three neonicotinoids (clothianidin, imidacloprid, and
thiamethoxam), which are expected to be totally banned for outdoor use in the
European Union (EU) by the end of 2018, were subjected to method validation.
The limit of quantitation of each analyte was 1 ng/g and it was sufficiently low
to determine pesticide residues below the levels of acute oral toxicity (LD50) of
the bee. The field monitoring was conducted in two area near the apple orchard
and pepper field in 2014. The analysis of the neonicotinoids and 391
multiresidue pesticides in apiculture samples were carried out. Based on residue
levels, comprehensive honey bee exposure near farmland was able to be
understood. Four representative crops were treated using miniaturized
Multiclass Pesticide Multiresidue Method (No. 2) of the Korea Food Code, and
the analytical method was evaluated for 384 pesticides using GC-MS/MS. As
a result, 95.1-99.5% of the total pesticides satisfied the method limit of
quantitation <10 ng/g in the crops, therefore the analytical method obtained the
sufficient detection ability required by positive list system.
Key words: bee product, crop, GC-MS/MS, honey bee, LC-MS/MS,
multiresidue, pesticide, serum, urine
iii
Table of Contents
Abstract...i Table of Contents...iii List of Tables...x List of Figures...xivList of Supplementary Information...xx
Preface...1
Chapter I. Development and Validation of Pesticide Multiresidue Analysis in Human Serum and Urine Using LC-MS/MS and GC-MS/MS...3
Introduction...4
Pesticide intoxication...4
Pesticide analysis in biological samples...5
Advantage of the tandem mass spectrometry...10
Preparation methodology for biological sample...10
iv
Part 1. Development and Validation of Pesticide Multiresidue Analysis
in Human Serum and Urine Using LC-MS/MS...13
Materials and Methods...14
Chemicals and reagents...14
Preparation of standard solutions...14
LC-MS/MS parameters...15
Comparison of three versions of QuEChERS...16
Final established sample preparation...17
Validation of analytical methods...17
Safety information...19
Results and Discussion...20
Optimization of multiple reaction monitoring (MRM) in LC-MS/MS...20
Relationship between partition-coefficient and retention time...21
Optimization of sample extraction step...26
Method validation...38
Limit of quantitation (LOQ)...38
Linearity of calibration...44
Accuracy and precision...50
Recovery...64
Matrix effect...79
v
Part 2. Development and Validation of Pesticide Multiresidue Analysis
in Human Serum and Urine Using GC-MS/MS...91
Materials and Methods...92
Chemicals and reagents...92
GC-MS/MS instrumental conditions...92
Establishment of scheduled MRM...93
Sample preparation using modified QuEChERS...94
Validation of methodology...94
Safety information...95
Results and Discussion...96
Characteristics of pesticide to be studied...96
Optimization of MRM...99
Determination of final selected pesticides to be validated...102
Validation of analytical method...103
Limit of quantitation (LOQ) and linearity of calibration...103
Accuracy and precision...110
Recovery...111
Matrix effect...114
vi
Chapter II. Analysis of Neonicotinoids (Clothianidin, Imidacloprid, and Thiamethoxam) and Pesticide Multiresidues in Honey Bee, Pollen, and
Honey Using LC-MS/MS and GC-MS/MS...119
Introduction...120
Benefits from honey bee...120
Honey bee Colony Collapse Disorder (CCD) ...120
Neonicotinoid, a suspicious chemical leading to CCD...121
Analysis of pesticide residues in apiculture samples...122
Purpose of the present study...123
Materials and Methods...126
Chemicals and reagents...126
Preparation of matrix-matched standards...127
Sample collection...127
Instrumental conditions of LC-MS/MS and GC-MS/MS...133
LC-MS/MS...133
GC-MS/MS...134
MRM optimization in LC-MS/MS and GC-MS/MS...135
Sample preparation...136
Method validation for clothianidin, imidacloprid, and thiamethoxam...137
Pesticide multiresidue screening in bee, pollen, and honey...137
Statistical analysis...138
vii
Results and Discussion...139
Body weights of honey bees...139
MRM optimization...141
Method validation for neonicotinoids...143
Analysis of neonicotinoids (clothianidin, imidaclprid, and thiamethoxam) in bee, pollen, and honey...145
Bee...145
Pollen...154
Honey...162
Analysis of pesticide multiresidues in bee, pollen, and honey...164
Conclusions...180
Chapter III. Multiresidue Analysis for 384 Pesticides in Pepper, Orange, Brown Rice, and Soybean Using Florisil Solid-phase Extraction and GC-MS/MS...183
Introduction...184
Introduction of positive list system...184
Tandem mass spectrometry for pesticide multiresidue analysis...186
Solid-phase extraction for pesticide purification...192
Multiclass Pesticide Multiresidue Method (No. 2) ...193
viii
Materials and Methods...196
Chemicals and reagents...196
Preparation of matrix-matched standard...196
Instrumental conditions of GC-MS/MS...197
Multiple reaction monitoring (MRM) profile optimization...198
Sample preparation of pepper, orange, brown rice, and soybean...198
Defatting procedure in soybean using n-hexane/acetonitrile partitioning...199
Method validation...199
Results and Discussion...201
MRM optimization and selection of pesticides to be validated...201
Characteristics of 384 pesticides...202
Comparison of the preparation procedures with/without n-hexane/ acetonitrile partitioning...203
Method limit of quantitation (MLOQ)...206
Instrumental repeatability...209
Linearity of calibration...210
Recovery...215
Matrix effect...224
ix
Supplementary Information...228
References...255
x
List of Tables
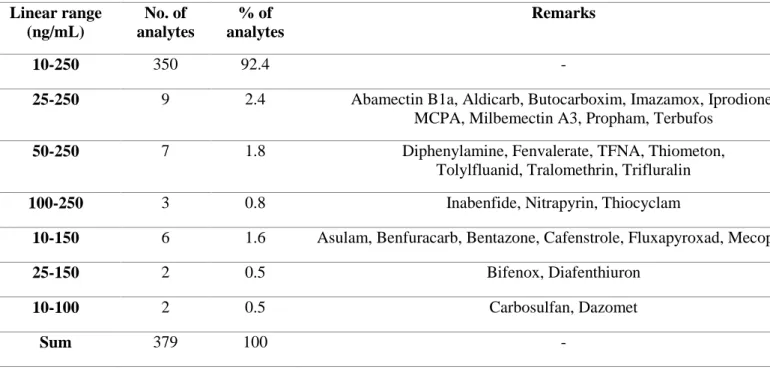
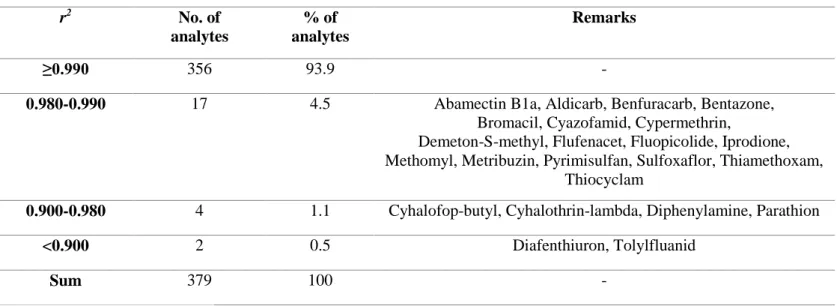
Table 1. Representative pesticide analytical methods in biological samples...7 Table 2. List of the 379 pesticides classified by chemical groups for the optimized analytical method in serum...28 Table 3. List of representative chemical groups and 380 pesticides selected for the final method validation in urine...30 Table 4. The number of pesticides with recoveries between 70-120% with RSDs below 20% in the recovery test from different extraction methods for 379 Pesticides in 100 μL of human serum (fortification Level at 250 ng/mL, n = 3)...36 Table 5. The number of pesticides with recoveries between 70-120% with RSDs below 20% in the recovery test from different extraction methods for 379 Pesticides in 100 μL of human urine (fortification Level at 250 ng/mL, n = 3)...37 Table 6. Distribution of linear ranges for 379 pesticides in serum for the final established analytical method...46 Table 7. Distribution of correlation coefficients (r2) for 379 pesticides in
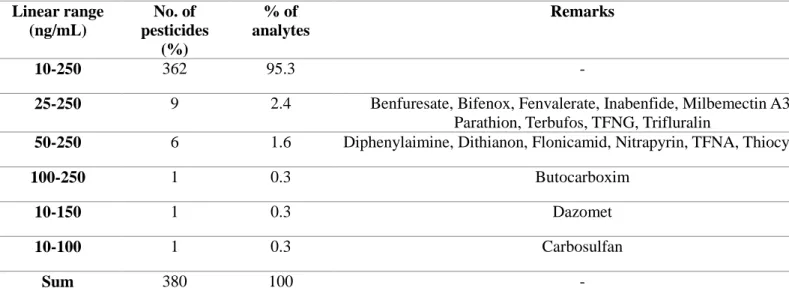
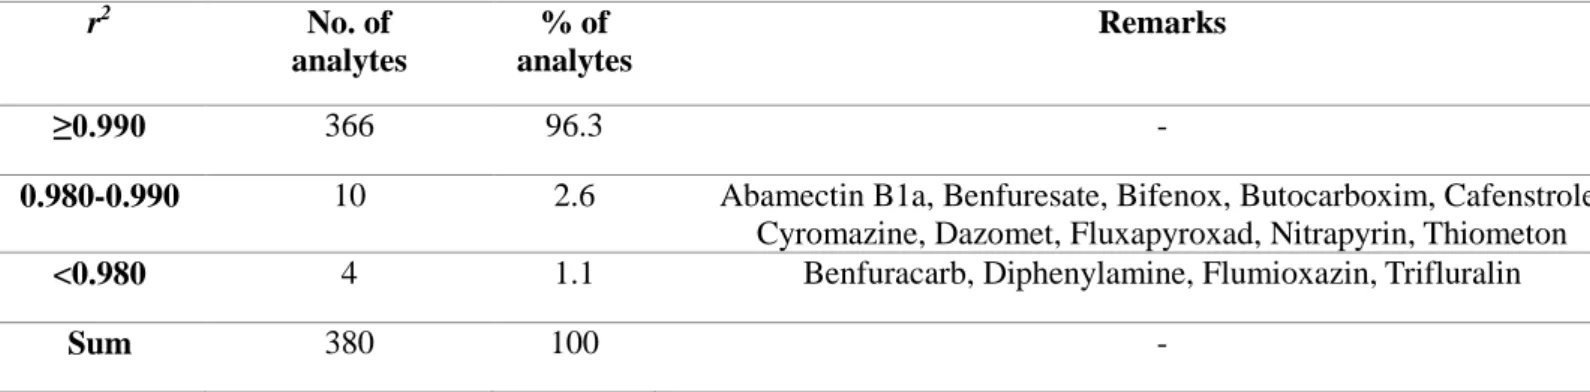
serum for the final established analytical method...47 Table 8. Distribution of linear ranges for 380 pesticides in urine for the final established analytical method...48
xi
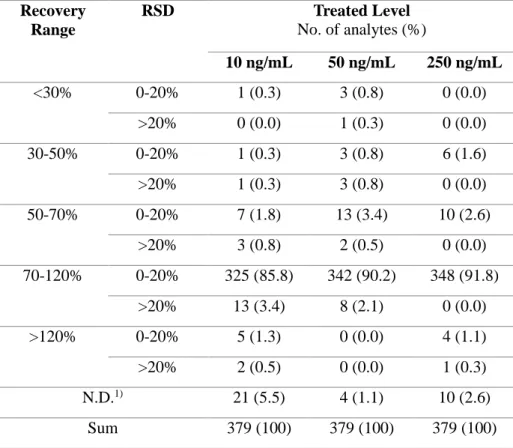
Table 9. Distribution of correlation coefficients (r2) for 380 pesticides in urine for the final established analytical method...49 Table 10. Distribution of recovery and RSD range for 379 pesticides at fortification levels of 10, 50, and 250 ng/mL in serum for the final established analytical method...68 Table 11. Pesticides for which recovery test results were not within
70-120% (RSD ≤20%) at all treated levels (10, 50, and 250 ng/mL), and intra-day accuracy results with RSD (serum)...70 Table 12. Distribution of recovery and RSD range for 380 pesticides at fortification levels of 10, 50, and 250 ng/mL in urine for the final established analytical method...78 Table 13. List of pesticides to be studied and their chemical groups...97 Table 14. The optimized GC-MS/MS parameters including retention times (tR), MRM transitions for each pesticide...100 Table 15. Representative pesticide multiresidue analytical method in
apiculture samples...124 Table 16. Sampling results in Giran during investigation period on April 24 to June 6, 2014...131 Table 17. Sampling results in Yeongyang during investigation period on July 6 to August 7, 2014...132 Table 18. The numbers of dead and healthy imago collected in the two areas and their total and average body weights...140
xii
Table 19. The established retention times (tR), monoisotopic masses, quasi-molecular ion types, and MRM transitions of LC-MS/MS for the neonicotinoid pesticides...142 Table 20. The limit of quantitation (LOQ), correlation coefficients (r2),
recovery results for neonicotinoid pesticides in bee, pollen, and honey samples...144 Table 21. Distribution of neonicotinoid residues in dead imago at three sites in Giran...147 Table 22. Distribution of neonicotinoid residues in dead imago at two sites in Yeongyang...148 Table 23. Distribution of neonicotinoid residues in pollen at two sites in Giran...155 Table 24. Distribution of neonicotinoid residues in pollen at two sites in Yeongyang...156 Table 25. Distribution of neonicotinoid residues in honey in Giran and
Yeongyang...163 Table 26. Positive detection frequency for bee, pollen, and honey samples in Giran...166 Table 27. Distribution of median values and residue ranges for pesticide multiresidues in Giran...170 Table 28. Positive detection frequency for bee, pollen, and honey samples in Yeongyang...174
xiii
Table 29. Distribution of median values and residue ranges for pesticide multiresidues in Yeongyang...178 Table 30. The current pesticide regulation in crops and PLS to be introduced in the Republic of Korea (Ministry of Food and Drug Safety)...185 Table 31. R e vi ew of t a n dem m a ss s pe ct ro m et ry f or p est i ci d e multiresidues in agricultural products during three-year publication (2016-2018)...188 Table 32. Representative analytical methods for pesticide multiresidues i n c l u d i n g s o l i d - p h a s e e x t r a c t i o n ( S P E ) c l e a n u p procedure...194 Table 33. Distribution of MLOQs for 384 pesticides in pepper, orange, brown rice, and soybean...208 Table 34. Summary of instrumental repeatability to show distribution of RSD of area for 384 pesticides in pepper, orange, brown rice, and soybean (n = 7)...211 Table 35. Distribution of correlation coefficients (r2) for 384 pesticides in pepper, orange, brown rice, and soybean...214 Table 36. Distribution of recoveries for 384 pesticides in pepper, orange, brown rice, and soybean...216
xiv
List of Figures
Fig. 1. Scatter plot to show retention time (tR) and partition-coefficient (log P) for 359 among 383 pesticides...22 Fig. 2. Comparison of log P values calculated using the 1st order regression model and values calculated in other works...24 Fig. 3. TIC obtained by LC-MS/MS analysis of (a) matrix-matched standard in human serum with 379 pesticides at 100 ng/mL (4 μL injection) and (b) TIC of control (non-fortified) serum sample...32 Fig. 4. TIC obtained by LC-MS/MS analysis of (a) matrix-matched standard in human urine with 380 pesticides at 100 ng/mL (4 μL injection) and (b) TIC of control (non-fortified) urine sample...34 Fig. 5. Pie chart showing distribution of LOQs (ng/mL) for 379 pesticides in serum for the final optimized analytical method. Light gray bar, 10 ng/mL; gray bar, 25 ng/mL; dark gray bar, 50 ng/mL; black bar, 100 ng/mL...40 Fig. 6. Pie chart showing distribution of LOQs (ng/mL) for 380 pesticides in urine for the final optimized analytical method. Light gray bar, 10 ng/mL; gray bar, 25 ng/mL; dark gray bar, 50 ng/mL; black bar, 100 ng/mL...42
xv
Fig. 7. Scatter plots for 379 pesticides in serum to show accuracies and precisions (RSD) in (a) intra-day and (b) inter-day tests (at 150 ng/mL of QC level)...52 Fig. 8. Percentage of 379 pesticides satisfying the accuracy values within 80-120% (RSD ≤20%) at 10 ng/mL and within 85-115% (RSD ≤15%) at 50, 150, and 250 ng/mL in the intra-day (grey bars) and inter-day (dark grey bars) tests using the final established method in serum sample...56 Fig. 9. Scatter plots for 380 pesticides in urine to show accuracies and precisions (RSD) in (a) intra-day and (b) inter-day tests (at 150 ng/mL of QC level)...60 Fig. 10. The number of pesticides satisfying the accuracy range of 80-120%
with RSD ≤20% at a QC level of 10 ng/mL and the accuracy range of 85-115 with RSD ≤ 15% at 50, 150, and 250 ng/mL levels under intra-day (grey bars) and inter-day (dark grey bars) conditions in urine sample...62 Fig. 11. Distribution to show recovery values for 379 pesticides classified into the representative chemical groups (treated at 50 ng/mL in serum)...66 Fig. 12. Recovery results (treated at 250 ng/mL in serum) of three
different QuEChERS extraction methods for pH-dependent pesticides that showed lower recovery rate in the validation test...72
xvi
Fig. 13. Distribution of recovery rates for 380 pesticides by representative chemical groups at f ortif ication levels of 50 ng/mL in urine...76 Fig. 14. Scatter plot to show tR and matrix effect of 379 pesticides in serum...80 Fig. 15. Distribution of matrix effects (%) for 379 pesticides classified
into soft effect (light grey bars, -20% to 0% and 0% to 20%), middle effect (grey bars, -50% to -20% and 20% to 50%), and strong effect (dark grey bars, <-50% and >50%) in human serum samples...84 Fig. 16. Scatter plot between retention time (tR) and matrix effect for 380 target pesticides in urine...86 Fig. 17. Summary of matrix effects for 380 pesticides classified into soft effect (light grey bars, -20% to 0% and 0% to 20%), middle effect (grey bars, -50% to -20% and 20% to 50%), and strong effect ( d a r k g re y b a r s , < - 5 0 % a n d > 5 0 %) i n h u m a n u r i n e samples...88 Fig. 18. Structures for phthalimide organochlorines, (a) captafol, (b)
captan, and (c) folpet. MRM chromatograms for matrix-matched standards of (d) captafol, (e) captan, (f) folpet, and (g)-(i) these recovery samples in serum, and MRM chromatograms for matrix-matched standards of (j) captafol, (k) captan, (l) folpet, and (m)-(o) these recovery samples in urine...104
xvii
Fig. 19. MRM chromatograms of (a) solvent-only standard, (b) matrix-matched standard in serum, and (c) matrix-matrix-matched standard in urine for binapacryl...106 Fig. 20. Individual LOQs and correlation coefficients (r2) of 55 pesticides
for the final established analytical method in serum and urine...108 Fig. 21. The number of pesticides satisfying the accuracy range of 80-120%
with RSD ≤20% at a QC level of 10 ng/mL and the accuracy range of 85-115 with RSD ≤ 15% at QC levels of 50, 150, and 250 ng/mL in (a) serum and (b) urine under intra-day (grey bars) and inter-day (dark grey bars) conditions...112 Fig. 22. Distribution of matrix effects for 380 pesticides in (a) serum and (b) urine. The matrix effect was classified into soft effect (light grey bars, -20% to 0% and 0% to 20%), middle effect (grey bars, -50% to -20% and 20% to 50%), and strong effect (dark grey bars, <-50% and >50%)...116 Fig. 23. Distribution of monitoring sites in the Republic of Korea...128 Fig. 24. Distribution of residues for (a) clothianidin, (b) imidacloprid, and (c) thiamethoxam in dead imago samples at three sites in Giran...150 Fig. 25. Distribution of residues for (a) clothianidin, (b) imidacloprid, and (c) thiamethoxam in dead imago samples at two sites in Yeongyang...152
xviii
Fig. 26. Distribution of residues for (a) clothianidin, (b) imidacloprid, and ( c) t hi am et h o xam i n p ol l en s am pl es a t t hree si t es i n Giran...158 Fig. 27. Distribution of residues for (a) clothianidin, (b) imidacloprid, and ( c ) t h i a m e t h o x a m i n p o l l e n s a m p l e s a t t w o s i t e s i n Yeongyang...160 Fig. 28. Distribution of the numbers of detection frequencies for
fluvalinate, etofenprox, carbaryl, acetamiprid, and spiromesifen, which ranked first to fifth among the pesticide multiresidues by the detection frequency...168 Fig. 29. Distribution of the numbers of detection frequencies for
fluvalinate, etofenprox, acephate, etofenprox, flubendiamide, and flonicamid, which ranked first to fifth among the pesticide multiresidues by the detection frequency...176 Fig. 30. Scan chromatograms (m/z 50-500) for control soybean samples of (a) partitioned and (b) non-partitioned procedures...204 Fig. 31. Relative peak area (100 at 1st injection) of DDT-p,p', fenfuram, folpet, methoxychlor (pepper), and chlorothalonil (orange) at 50 ng/mL to show peak decreases as the number of injections increases...212 Fig. 32. Percentages of pesticides satisfying recovery 70-120% (RSD
xix
Fig. 33. Percentages of pesticides satisfying recovery 70-120% (RSD ≤20%) classified by chemical groups at (a) 0.01 mg/kg and (b) 0.05 mg/kg...222 Fig. 34. Distribution of matrix effects for 384 pesticides in pepper, orange, brown rice, and soybean. Group 3 and 4 are included in soft matrix effect, Group 2 and 5 in medium effect, and Group 1 and 6 in strong effect...226
xx
List of Supplementary Information
Table S1. The retention times (tR), monoisotopic masses, quasi-molecular ion types, and MRM transitions of LC-MS/MS for the multiresidual pesticides...228 Table S2. The optimized GC-MS/MS parameters including retention times (tR), MRM transitions for each pesticide...233 Table S3. List of general pesticide information for 384 pesticides...239
1
Preface
Pesticides are used worldwide for the control of insects, microorganisms, fungi,
and other harmful pests in order to protect agricultural products. According to
a U.S. Environmental Protection Agency (EPA) report, world pesticide
expenditure at the producer level was $55,921 million in 2012 (Atwood and
Paisley-Jones, 2017). In the United States, $8,866 million was reported on the
same basis, corresponding to 16% of the world pesticide market (Atwood and
Paisley-Jones, 2017). In the Republic of Korea, the Korea Crop Protection
Association’s agrochemical book reported that the amount of pesticide
shipment was 19,798 tons in 2016 (Korea Crop Protection Association, 2017).
Use of pesticide has contributed to improving productivity, protection
of crop losses/yield reduction, and food quality (Aktar et al., 2009). Cooper and
Dobson (2007) reported that the use of pesticides has contributed to the
improvement of crop/livestock yields and quality, increased shelf life of
produce, and prevention of harmful organisms from interfering in human
activities and structures, from which secondary benefits such as national
agricultural economic development, reduced maintenance costs, or quality of
life improvement have followed (Cooper and Dobson, 2007).
Although pesticide has been a great influence on food security over the
decades, its toxicological/ecotoxicological effects on human and the ecosystem
also cannot be ignored. It is important to maintain pesticide residues below
sustainable levels in crops and the environment and to monitor in human,
2
The purpose of the study is the analysis of pesticide multiresidues in
biological, apiculture samples, and representative crops. For the effective and
high-throughput multiresidue analysis, the scheduled multiple reaction
monitoring (MRM) mode of gas or liquid chromatography-tandem mass
spectrometry (GC-MS/MS or LC-MS/MS) was employed in every
methodology.
The study comprises three chapters. In Chapter I, novel bioanalytical
methods for multiresidual pesticides in serum and urine were developed using
LC-MS/MS (Part 1) after the comparison of three scaled-down QuEChERS
methods and validated with various parameters. These methodologies were
applied for GC-MS/MS amenable pesticides and the validation results in serum
and urine were discussed in Part 2. In Chapter II, modified QuEChERS
methods for neonicotinoids (clothianidin, imidacloprid, and thiamethoxam)
were validated in honey bee, pollen, and honey. With this analytical method and
multiresidue screening method, pesticide residues in apiculture samples were
determined and risk assessment was attempted for some pesticides in an aspect
of ecotoxicology. In the last chapter, Multiclass Pesticide Multiresidue Method
(No. 2) of the Korea Food Code was modified by scaling-down, and
approximately two hundreds of pesticides were newly verified with an original
GC-MS/MS list (about 200 pesticides) in the method (Chapter III). The
reinforced analytical method was validated and evaluated in four representative
crops (pepper, orange, brown rice, and soybean).
This pesticide multiresidue research provides a comprehensive
methodology for the residue determination in three major fields such as
3
Chapter I
Development and Validation of Pesticide
Multiresidue Analysis in Human Serum and Urine
Using LC-MS/MS and GC-MS/MS
4
Introduction
Pesticide intoxication
One of the major disadvantages of pesticides affected by human is that these
chemicals cause acute poisoning problems. Acute intoxication symptoms
caused by pesticides range from mild symptoms such as nausea, headache, and
paresthesia to fatalities (Thundiyil et al., 2008). Pesticide intoxication resulting
from intentional intake or misuse is a major social issue. Gunnell et al. (2007)
investigated the global distribution of suicide by pesticide and estimated that
there are 258,234 (plausible range from 233,997 to 325,907) suicides from
pesticide poisoning each year, representing 30% (27% to 37%) of all suicides
worldwide (Gunnell et al., 2007). In the United States, 234 deaths by pesticide
poisoning were identified over a 10 year span (1999 to 2008) according to the
Centers for Disease Control and Prevention’s Wide-ranging Online Data for
Epidemiologic Research (CDC WONDER) report, and an average of 20,116
people were exposed to pesticides annually, accounting for 17.8% of treatment
in healthcare facilities from 2006 to 2010 (Langley and Mort, 2012). In the
Republic of Korea, 16,161 reports of mortality and 45,291 reports of inpatient
and outpatient treatment related to pesticide intoxication were reported during
5 years (2006 to 2010) (Cha et al., 2014).
Various occupational researches have revealed that a large number of
farmers have experienced pesticide intoxication. Calvert et al. (2008)
investigated 3,271 cases of acute pesticide poisoning in the United States from
1998 to 2005 and reported that 2,334 (71%) were employed as farmworkers
5
intoxication may be experienced by agricultural workers in the Asian
developing country (Jeyaratnam, 1990). In the Republic of Korea, it was
reported that 22.9% of 1,958 male farmers had experienced acute intoxication
symptoms within 48 h after using pesticides in 2010 (Kim et al., 2013). More
recently, Lee and coworkers in 2015 have surveyed 663 farmers in Gyeong-gi
province, South Korea, and 44 (6.63%) of them responded that they had
experienced acute poisoning within 24 h of spraying pesticide directly or
indirectly during 2013-2014 (Lee et al., 2015).
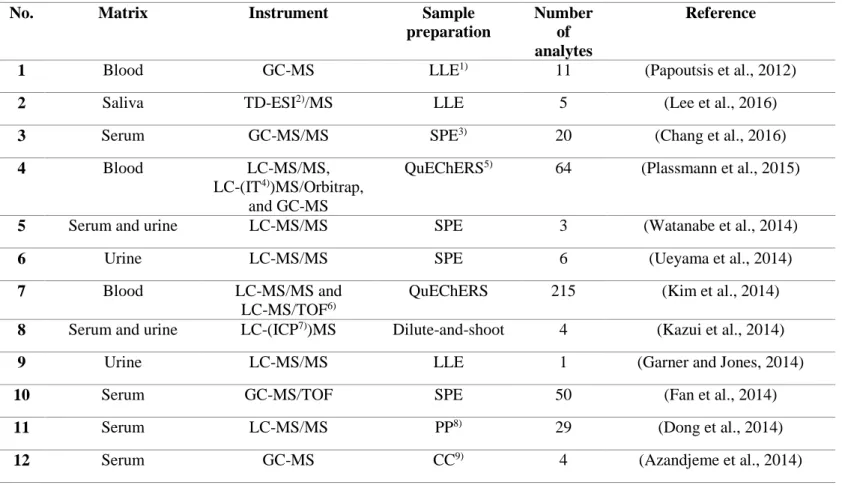
Pesticide analysis in biological samples
Biological monitoring of pesticide poisoning is useful for identifying evidence
of health problems in the environment/ecotoxicology, in the agricultural and
forensic fields, or for detoxification in a medical institution. Human biological
samples such as blood, urine, hair, and saliva have been primary sources for
determination of pesticides (Table 1).
Among the biological samples, blood is a regulated fluid, which means
that its volume does not vary substantially with water intake or other factors
(Barr et al., 2002). Therefore, blood is available without further dilutions for
determination of the internal concentration of pesticides. It is also advantageous
that pesticides are present in blood as parent compounds instead of their
metabolites as usually found in urine (Wessels et al., 2003), and blood has less
risk of exogenous or endogenous contamination compared to hair (Altshul et
al., 2004). Because only a few milliliters of blood from adults or less in the case
of children can be obtained, analytical methods for a few tens or several
6
overcome the sample volume problem (Mostafa et al., 2011; Saito et al., 2013;
Wittsiepe et al., 2014). Serum analysis is usually preferred over whole blood
analysis, because serum has a minor matrix complexity, and is a more
homogenous material (Gill et al., 1996; Hernández et al., 2002). Therefore, one
or more cleanup steps can be reduced with serum samples compared to whole
blood (Lacassie et al., 2001a; Hernández et al., 2002).
Urine also has several advantages over other samples. Urine is easier to
obtain than invasive samples such as blood, and larger amounts of urine are
available compared with blood, hair, and saliva. Because urine is a
homogeneous biological fluid composed of 95% water (Cortéjade et al., 2016),
complex preparation steps for purification of target pesticides are not needed.
Although most pesticides are metabolized rapidly in the body and excreted in
urine as free metabolites, mercapturate detoxification products, and/or
glucuronide or sulfate-bound compounds within 48 h (Hernández et al., 2005),
various chemical groups of pesticides still remain intact and present in urine
(Montesano et al., 2007; Usui et al., 2012; Quansah et al., 2016). It is easier and
less costly to obtain analytical standards of pesticides rather than those of
metabolites.
Screening of as many parent compounds as possible is also needed in
many applications because there have been deaths resulting from various
chemical groups of pesticides (Lee et al., 2010), some of them (e.g.,
benzoximate and etofenprox) showing very low acute toxicity (LD50 >10,000
7
Table 1. Representative pesticide analytical methods in biological samples
No. Matrix Instrument Sample
preparation
Number of analytes
Reference
1 Blood GC-MS LLE1) 11 (Papoutsis et al., 2012)
2 Saliva TD-ESI2)/MS LLE 5 (Lee et al., 2016)
3 Serum GC-MS/MS SPE3) 20 (Chang et al., 2016)
4 Blood LC-MS/MS,
LC-(IT4))MS/Orbitrap,
and GC-MS
QuEChERS5) 64 (Plassmann et al., 2015)
5 Serum and urine LC-MS/MS SPE 3 (Watanabe et al., 2014)
6 Urine LC-MS/MS SPE 6 (Ueyama et al., 2014)
7 Blood LC-MS/MS and LC-MS/TOF6)
QuEChERS 215 (Kim et al., 2014)
8 Serum and urine LC-(ICP7))MS Dilute-and-shoot 4 (Kazui et al., 2014)
9 Urine LC-MS/MS LLE 1 (Garner and Jones, 2014)
10 Serum GC-MS/TOF SPE 50 (Fan et al., 2014)
11 Serum LC-MS/MS PP8) 29 (Dong et al., 2014)
8
Table 1. (Continued)
No. Matrix Instrument Sample
preparation Number of analytes Reference 13 Serum LC-MS/MS Monolithic spin column 16 (Saito et al., 2013)
14 Hair and Urine LC-MS SLE10) and LLE 2 (Kavvalakis et al., 2013) 15 Blood and urine LC-MS/MS QuEChERS 6 (Usui et al., 2012)
16 Blood and urine GC-MS SPE 1 (Takayasu et al., 2012)
17 Hair GC-MS/MS SPME11) 50 (Schummer et al., 2012) 18 Serum and urine LC-FLD Dilute-and-shoot 2 (Esteve-Romero et al., 2012)
19 Serum and urine GC-MS Monolithic spin column
3 (Saito et al., 2011)
20 Plasma LC-MS/MS PP 3 (Mostafa et al., 2011)
21 Serum GC-MS SPME 2 (Kasiotis et al., 2011)
22 Urine GC-(IT)MS/MS and LC-MS/MS
SPE >200 (Cazorla-Reyes et al., 2011)
23 Urine LC-MS/MS LLE 6 (Montesano et al., 2007)
9
Table 1. (Continued)
No. Matrix Instrument Sample
preparation
Number of analytes
Reference
25 Serum and plasma GC-HR12)MS SPE 29 (Barr et al., 2002) 26 Blood, serum GC-MS SPE 29 (Lacassie et al., 2001a)
27 Serum LC-MS and
GC-MS
SPE 61 (Lacassie et al., 2001b)
28 Serum and urine LC-MS/MS PP and Direct injection
2 (Sancho et al., 2000)
1)Liquid-liquid extraction 7)Inductively coupled plasma 2)Thermal desorption electrospray 8)Protein precipitation 3)Solid-phase extraction 9)Column chromatography 4)Ion-trap 10)Solid-liquid extraction 5)Quick, Easy, Cheap, Effective, Rugged, and Safe 11)Solid-phase microextraction 6)Time-of-flight 12)High resolution
10
Advantage of the tandem mass spectrometry
In the case of pesticide intoxication, analysis of multiresidue pesticides with
high reliability and speed is important in order to identify unknown compounds
for further medical treatment and forensic investigation. Traditional liquid
chromatography (LC) and gas chromatography (GC) have many limitations in
specificity, sensitivity, and speed for multiresidue analysis (Aysal et al., 2007;
Moliner-Martínez et al., 2011). Furthermore, both conventional instruments
require partitioning or cleanup procedures to remove interference, which takes
a long time, uses high volumes of solvents, and may remove target compounds
during extensive cleanup steps. A single quadrupole (SQ) mass filter overcomes
some problems by performing selected ion monitoring (SIM) but still can fail
to distinguish a target pesticide from other pesticides or interferences with a
similar retention time (tR) and m/z. Tandem mass spectrometry coupled with
liquid chromatography (LC) or gas chromatography (GC) has been widely
utilized. Among the tandem mass spectrometry, triple quadrupole (TQ)
analyzers is a powerful analytical technique for quantitative detection of a broad
range of pesticides in short time with simultaneous manner by operating in
multiple reaction monitoring (MRM) mode in biological monitoring.
Preparation methodology for biological sample
In various alternative cleanup procedures for serum and urine sample, column
chromatography (CC), solid-phase extraction (SPE), liquid-liquid extraction
(LLE) have been reported as representative preparation methods (Table 1).
Protein precipitation (PP) with acetonitrile solvent is specific for blood (serum)
11
and SPE are advantageous for a few specific target compounds, but take much
time and effort to conduct and have some difficulty finding optimum
washing/elution conditions covering various chemical properties. LLE and PP
are more convenient than CC or SPE, but have similar drawbacks to CC or SPE
and interferences of serum or urine may remain in the extract to cause a serious
matrix effect or lead to low extraction efficiency.
The aqueous characteristic of urine and advanced separation techniques
such as LC- or GC-MS/MS make urine preparation relatively convenient and
easy. Direct injection or dilute-and-shoot procedures are the simplest ways to
identify pesticides in urine (Esteve-Romero et al., 2012; Kazui et al., 2014;
Cortéjade et al., 2016). Nevertheless, these processes have major problems in
that urinary salts or macromolecules may decrease the sensitivity of an
instrument or cause severe clogging on the injection syringe or ESI probe.
The QuEChERS (Quick, Easy, Cheap, Effective, Rugged, and Safe)
method is a preparation method with strong extraction efficiency and
convenience in multiresidue analysis. Since the first unbuffered QuEChERS
analytical method for crops was developed in 2003, a number of improved
QuEChERS methods have been validated and applied (Anastassiades et al.,
2003). Among these methods, AOAC 2007.01 and EN 15662 methods, in
which buffer reagents are contained for adjustment of sample pH, have been
used widely with advantages in extraction rate (recovery) of pH-dependent
pesticides (Lehotay, 2007; EN 15662, 2008). Recently, QuEChERS methods
have been used for biological samples in clinical and forensic toxicology (Usui
12
Purpose of the present study
In this study, a simultaneous multiresidue screening analytical method in
human serum and urine was developed and validated using LC- and
GC-MS/MS. The scheduled MRMs and retention times (tR) for each analyte were
optimized for qualification and quantitation within 15 minutes (LC-MS/MS)
and 30 minutes (GC-MS/MS) per sample. This chapter of the study is
comprised of two part. In Part 1, 379 pesticides in serum and 380 in urine were
investigated using LC-MS/MS. Three different versions of QuEChERS
extraction methods were compared and modified to use a very small sample
volume (100 μL) without using dispersive SPE (dSPE) in the cleanup procedure. Using the established method in Part 1, 54 pesticide in serum and 55 in urine
were evaluated using GC-MS/MS in Part 2. It was found that acceptable
validation data (limit of quantitation (LOQ), linearity of calibration, accuracy
and precision, recovery, and matrix effect) for most pesticides were obtained.
This fast and convenient analytical method is applicable for biomonitoring of
pesticide multiresidues in serum and urine samples from food toxicology,
13
Part 1
Development and Validation of Pesticide
Multiresidue Analysis in Human Serum and Urine
Using LC-MS/MS
14
Materials and Methods
Chemicals and reagents
Individual pesticide standards (purity >98%) or stock solutions (1,000 mg/L)
for quality control (QC) were obtained from ChemService (West Chester, PA),
Dr. Ehrenstorfer (Augsburg, Germany), Sigma-Aldrich (St, Louis, MO), Wako
Pure Chemical Industries (Osaka, Japan), and ULTRA Scientific (North
Kingstown, RI). Ammonium formate (≥99.0%), formic acid (LC-MS grade), acetic acid (HOAc, ≥99.7%), magnesium sulfate anhydrous (MgSO4, ≥99.5%),
sodium acetate anhydrous (NaOAc, ≥99.0%), sodium citrate dibasic sesquihydrate (Na2HCitr·1.5H2O, ≥99.0%), and sodium citrate tribasic
dihydrate (Na3Citrate·2H2O, ≥99.0%) were purchased from Sigma-Aldrich.
Sodium chloride (NaCl, 99.0%) was obtained from Samchun (Gyeonggi-do,
South Korea). Methanol and acetonitrile (HPLC grade) were purchased from
Fisher Scientific (Seoul, South Korea). Ceramic homogenizers (2 mm) were
purchased from Ultra Scientific. Deionized water was prepared in house using
LaboStar TWF UV 7 (Siemens, MA). Serum from human male was obtained
from Sigma-Aldrich. Human urine was collected from healthy volunteers with
the permission of the Institutional Review Board (IRB) at Seoul National
University, Seoul, the Republic of Korea. Samples were stored at -70 °C until
preparation and analysis.
Preparation of standard solutions
Individual pesticide stock solutions (1,000 mg/L) were prepared in acetonitrile.
15
carbendazim), acetone, methanol, or water were used instead of acetonitrile or
lower concentrations of stock solutions were prepared so that these components
could be sufficiently dissolved. To prepare four groups of intermediate mixed
stock solutions at 10 mg/L, a portion of each stock solution was brought up with
acetonitrile in a 25-mL volumetric flask. The aliquots of intermediates were
again mixed to make a final mixed standard solution at 2.5 mg/L. This was
diluted with acetonitrile to make the mixed working standard solutions of lower
concentrations for preparing calibration curves and using in several validation
procedures.
LC-MS/MS parameters
LC-MS/MS analysis was carried out on a Shimadzu Nexera X2 UHPLC
system coupled to a Shimadzu LCMS-8050 triple quadrupole mass
spectrometer (Kyoto, Japan). The UHPLC system comprised a solvent delivery
module (LC-30AD), column oven (CTO-20A), autosampler (SIL-30AC), and
degassing unit (DGU-20A5R). A Kinetex C18 column (100 × 2.1 mm, 2.6 µm,
Phenomenex, Torrance, CA) was used for analyte separation, and a
SecurityGuard Ultra guard column (Phenomenex) was connected to the column
to prevent contamination. The oven temperature was maintained at 40 °C. The
total flow rate of the mobile phase was 0.2 mL/min. For the mobile phases,
solvent A was 5 mM ammonium formate and 0.1% formic acid in water and B
was 5 mM ammonium formate and 0.1% formic acid in methanol. For the
gradient program, mobile phase B was initialized at 5%, and after 0.5 minutes,
B was raised to 55% for 0.5 min, ramped to 95% for 7 min, held for 3 min,
16
2.9 min. The total analytical time was 15.0 min, and the injection volume was
4 µL. LabSolutions software (version 5.72) was used for multiresidue MRM
data processing.
In the mass spectrometer system, ionization of target analytes was
performed by a heated electrospray ionization (ESI) with positive/negative
switching mode. The interface, desolvation line (DL), and heat block
temperature were 300, 250, and 400 °C, respectively. The heating gas (air),
nebulizing (nitrogen), and drying gas (nitrogen) flow were 10, 3, and 15 L/min,
respectively. The collision-induced dissociation (CID) gas was argon. For
MS/MS analysis, each standard solution (0.1-1 mg/L) was injected without the
column to obtain a full scan spectrum (m/z 50-500 or m/z 100-1,000). A
precursor ion (e.g., [M+H]+) was selected from the spectrum data and subjected
to collision with several collision energy (CE) voltages to find the two product
ions that showed the highest and the second highest detection intensity. The
former ion transition was used as a quantifier for quantitation of the target
compound, and the latter was used as a qualifier for its reference. This MRM
was scheduled by the retention time of each compound, and the MRM detection
window was ±0.5 min. Finally, dwell times (≥ 2.0 ms) were adjusted automatically based upon loop time (0.12 s) for the maximized data acquisition.
LabSolutions (version 5.72) as LCMS software was utilized for data processing.
Comparison of three versions of QuEChERS
Human serum and urine (0.1 mL) were extracted with three different
QuEChERS extraction reagents scaled-down as follows: (A) original
17
mg of MgSO4, and 10 mg of NaCl); (B) QuEChERS of AOAC 2007.01
(Lehotay, 2007) procedure (1% HOAc in acetonitrile (0.4 mL), 40 mg of
MgSO4, and 10 mg of NaOAc); and (C) QuEChERS of EN 15662 (EN 15662,
2008) procedure (0.4 mL of acetonitrile, 40 mg of MgSO4, 10 mg of NaCl, 10
mg of Na3Citrate·2H2O, and 5 mg of Na2HCitr·1.5H2O). The extract from each
method was centrifuged and 0.2 mL of supernatants were mixed with 0.05 mL
of acetonitrile for matrix-matching. Each of serum and urine sample was
equivalent to 0.2 mL per mL of final extract. Finally, 4 µL of the sample was
analyzed by LC-MS/MS.
Final established sample preparation
Each serum and urine (0.1 mL) sample in a 2-mL microcentrifuge tube was
extracted respectively, with 0.4 mL of acetonitrile by shaking for 1 min at 1,200
rpm using a Geno Grinder (1600 MiniG SPEX Sample Prep, Metuchen, NJ).
Forty milligrams of MgSO4 and 10 mg of NaCl were added under ice bath
conditions to prevent heat caused by MgSO4. The tube was centrifuged for 5
min at 13,000 rpm using microcentrifuge (17TR, Hanil Science, Seoul, the
Republic of Korea). The supernatant (0.2 mL) was transferred into a 2-mL
amber glass vial and mixed with 0.05 mL of acetonitrile for matrix-matching.
Without further cleanup steps, 4 µL of the final extraction sample was taken
into LC-MS/MS for analysis of target analytes.
Validation of analytical methods
For determination of the LOQ and linearity of calibration, matrix-matched
18
analyzed. The minimum concentration satisfying a signal to noise ratio (S/N)
greater than 10 on the chromatogram was selected as the LOQ.
The linearity of calibration was evaluated (n = 5) by the correlation
coefficient (r2) of the calibration curve from 10 to 250 ng/mL. The r was
calculated using the following equation (Almeida et al., 2002):
𝑟𝑟 = ∑ 𝑤𝑤𝑖𝑖∙ ∑ 𝑤𝑤𝑖𝑖𝑥𝑥𝑖𝑖𝑦𝑦𝑖𝑖− ∑ 𝑤𝑤𝑖𝑖𝑥𝑥𝑖𝑖∙ ∑ 𝑤𝑤𝑖𝑖𝑦𝑦𝑖𝑖
�∑ 𝑤𝑤𝑖𝑖∙ ∑ 𝑤𝑤𝑖𝑖𝑥𝑥𝑖𝑖2−(∑ 𝑤𝑤𝑖𝑖𝑥𝑥𝑖𝑖)2∙ �∑ 𝑤𝑤𝑖𝑖∙ ∑ 𝑤𝑤𝑖𝑖𝑦𝑦𝑖𝑖2−(∑ 𝑤𝑤𝑖𝑖𝑦𝑦𝑖𝑖)2 where: 𝑤𝑤𝑖𝑖= a weighting regression factor
𝑥𝑥𝑖𝑖 𝑎𝑎𝑎𝑎𝑎𝑎 𝑦𝑦𝑖𝑖 =𝑖𝑖th data pair of 𝑎𝑎 total data pairs
A weighting regression factor of 1/x (wi = 1/xi) was adopted to minimize
calculation error at low concentrations. By using the weighting method, a 1st
order linear regression model (y = a + bx) from the least squares approximation
was converted adding weighting factor wi (Almeida et al., 2002).
𝑏𝑏 =∑ 𝑤𝑤𝑖𝑖∑ 𝑤𝑤∙ ∑ 𝑤𝑤𝑖𝑖𝑥𝑥𝑖𝑖𝑦𝑦𝑖𝑖− ∑ 𝑤𝑤𝑖𝑖𝑥𝑥𝑖𝑖∙ ∑ 𝑤𝑤𝑖𝑖𝑦𝑦𝑖𝑖 𝑖𝑖∙ ∑ 𝑤𝑤𝑖𝑖𝑥𝑥𝑖𝑖2−(∑ 𝑤𝑤𝑖𝑖𝑥𝑥𝑖𝑖)2 𝑎𝑎 =∑ 𝑤𝑤𝑖𝑖𝑥𝑥∑ 𝑤𝑤𝑖𝑖2∙ ∑ 𝑤𝑤𝑖𝑖𝑦𝑦𝑖𝑖− ∑ 𝑤𝑤𝑖𝑖𝑥𝑥𝑖𝑖∙ ∑ 𝑤𝑤𝑖𝑖𝑥𝑥𝑖𝑖𝑦𝑦𝑖𝑖
𝑖𝑖∙ ∑ 𝑤𝑤𝑖𝑖𝑥𝑥𝑖𝑖2−(∑ 𝑤𝑤𝑖𝑖𝑥𝑥𝑖𝑖)2
where: 𝑏𝑏= slope of the regression equation 𝑎𝑎 = 𝑦𝑦 intercept of the regression equation
Accuracy and precision tests were performed using a QC sample (a sample with
a known quantity of analyte (US FDA, 2013)) at 10, 50, 150, and 250 ng/mL
19
treated level in a single day. The inter-day tests were carried out by analyzing
one QC sample of each treated level per day for five separate days.
To verify the extraction efficiency of the preparation process, recovery
tests at fortification levels of 10, 50, and 250 ng/mL were conducted. Five µL
of mixed working standard solutions (200, 1,000, and 5,000 ng/mL) in
acetonitrile were fortified in 0.1 mL of each blank serum or urine, respectively
and the treated samples were prepared as the final established preparation
procedures (n = 3). Recovery of target compounds was determined using
calibration curves of matrix-matched standards to compensate for matrix effects
in LC-MS/MS analysis.
The matrix effect was also calculated by comparing the slope of the
calibration curve of the matrix-matched standards with that of the calibration
curve of the solvent-based standards using the following equation:
Matrix effect, % = �Slope of matrix-matched standard calibration
Slope of solvent-based standard calibration − 1� × 100
Safety information
All pesticide standards and reagents used in this study were handled according
to the Material Safety Data Sheet (MSDS)’s safety instructions. For all
instrumentation, the manufacturer's safety information was followed and
20
Results and Discussion
Optimization of multiple reaction monitoring (MRM) in LC-MS/MS
For the determination of MRM transition profiles, a full scan analysis was first
performed with 400 pesticides. In this step, 17 compounds (binapacryl,
bromophos-methyl, chlorpropham, cyanophos, cyfluthrin, dichlofluanid,
dicofol, disulfoton, endosulfan-sulfate, ethalfluralin, isofenphos,
isofenphos-methyl, nitrothal-isopropyl, oxyfluorfen, parathion-isofenphos-methyl, silafluofen, and
spiromesifen) did not give a suitable quasi-molecular ion (precursor ion) and
were excluded. These compounds were analyzed using GC-MS/MS in Part 2.
The remaining 383 components successfully produced precursor ions. Among
them, 326 target compounds were [M+H]+ quasi-molecular ion form, 24
compounds were [M+NH4]+ form, seven compounds (abamectin B1a,
alanycarb, aldicarb, butocarboxim, lepimectin A3, lepimectin A4, and
pyribenzoxim) were [M+Na]+ form, and two compounds (milbemectin A3 and
milbemectin A4) were [M+H-H2O]+ form in the ESI positive mode. Twenty
three pesticides were [M-H]- form and dithianon showed an ion form [M·]- in
the ESI negative mode. After CID step, quantifier and qualifier ions were
selected depending on intensity. After MRM optimization steps, retention time
and sensitivity of target compounds were verified using both the solvent-based
standards (acetonitrile) and matrix-matched standard of serum and urine.
However, folpet was rejected after this step due to its poor response in all
21
Relationship between partition-coefficient and retention time
The partition-coefficient, abbreviated P, is the ratio of the concentration of a
compound in liquid A and B when the two-layer solution is equilibrium at a
constant pH and temperature. Usually, un-ionized water and octanol are used
as liquid A and B. In this case, P value is a parameter of hydrophobicity. The P
value is expressed as the logarithm and calculated using the following equation:
log 𝑃𝑃 = log([𝑠𝑠𝑠𝑠𝑠𝑠𝑠𝑠𝑠𝑠𝑠𝑠][𝑠𝑠𝑠𝑠𝑠𝑠𝑠𝑠𝑠𝑠𝑠𝑠]𝑜𝑜𝑜𝑜𝑜𝑜𝑜𝑜𝑜𝑜𝑜𝑜𝑜𝑜 𝑤𝑤𝑜𝑜𝑜𝑜𝑡𝑡𝑡𝑡)
There have been attempts to measure log P from the retention times (tR)
of various compounds using HPLC (Valko et al., 2001). In this study, log P and
retention time (tR) established from MRM profiles were investigated and the
relationship between the two parameters was verified. Among the 383
pesticides, log P values for 359 compounds were found (MacBean, 2012;
Turner, 2015). The correlation coefficient (r, unweighted) value between tR and
log P was +0.8737 (Fig. 1). The results showed that tR and log P have strong
positive correlations. Using the 1st order regression model (y = 0.8701x -
2.3548), log P values for the remaining 24 pesticides that have no log P data
were predicted (Fig. 2). The results were compared to the calculated log P data
from other works (IUPAC; Chemicalize.org, 2017). The results showed that the
log P values of most pesticides from the two data sources were similar. Unlike
these compounds, cartap exhibited a significant difference (>3) between the two
data. In order to establish a more elaborate model to explain well between the
two variables, more information on pesticides such as pKa is needed in addition
22
Fig. 1. Scatter plot to show retention time (tR) and partition-coefficient (log
23
y = 0.8701x - 2.3548
-4
-2
0
2
4
6
8
10
0
3
6
9
12
log
P
24
Fig. 2. Comparison of log P values calculated using the 1st order regression
25
-1.0
0.0
1.0
2.0
3.0
4.0
5.0
6.0
7.0
C
al
cu
lat
ed
l
og
P
Pesticide
26
Optimization of sample extraction step
Serum and urine are liquid-based samples, so it is appropriate to prepare the
sample using QuEChERS methods for high extraction efficiency (recovery) of
multiresidual pesticides. Since the first QuEChERS method for crops was
developed using GC-MS in 2003 (Anastassiades et al., 2003), there have been
preparation procedure improvements for LC amenable pesticides or lower
recovery rate compounds such as pH-dependent pesticides (Koesukwiwat et al.,
2008; Ribeiro Begnini Konatu et al., 2017). The official procedures such as the
AOAC 2007.01 method containing acetate buffers and the EN 15662 method
containing citrate buffers have been developed to improve recovery efficiency
for pH-dependent pesticides (Lehotay, 2007; EN 15662, 2008). The entire or a
portion of these types of QuEChERS methods have been utilized or modified
depending on the characteristics of the pesticides and sample matrices in many
analytical studies (Rejczak and Tuzimski, 2015).
In this study, the sample size was reduced to 0.1 mL, and optimization
of the final preparation step was established by comparing the scaled-down
methods from three different QuEChERS procedures (Anastassiades et al.,
2003; Lehotay, 2007; EN 15662, 2008).
For the serum sample, bensultap, dithianon, and the acidic flonicamid
metabolite TFNG [N-(4-trifluoromethylnicotinoyl)glycine] were again rejected
because they could not be recovered. Except for the rejected three analytes
(bensultap, dithianon, and TFNG), the remaining 379 pesticides were selected
as the final research analytes in serum (Table 2). For the urine sample, aldicarb
27
Therefore, these two compounds were excluded, and the remaining 380
pesticides were selected for final validation in urine (Table 3).
The total ion chromatogram (TIC) for the 379 target analytes in serum
and the 380 analytes urine sample is shown in Fig. 3 and 4. There were no false
positives in non-fortified serum samples, and no overlaps were observed
between pesticides in fortified samples.
The number of pesticides that satisfied the recovery range from 70 to
120% with relative standard deviation (RSD) below 20% based on the criteria
of SANTE/11813/2017 (European Commission, 2017) and their percentage
ratio for each extraction method in serum and urine are shown in Table 4 and
5. There was no significant difference in the number of analytes satisfying the
recovery criteria between the three methods in both matrices. For the serum
sample, 344 (90.8%), 341 (90.0%), and 341 (90.0%) of the total 379 pesticides
satisfied the recovery criteria for methods (A), (B), and (C), respectively.
Method (A), the unbuffered condition, showed slightly higher number of
pesticides than the others. For the urine sample, 360 (94.7%), 359 (94.5%), and
357 (93.9%) of total pesticides for methods (A), (B), and (C) fell within the
criteria, respectively. From the optimization experiment results, the final
preparation method using method (A) (downsized original QuEChERS) was
established in both matrices. In addition, further cleanup steps, such as dSPE,
were discarded in this treatment method to prevent the loss of labile target
28
Table 2. List of the 379 pesticides classified by chemical groups for the
optimized analytical method in serum
Chemical group (No. of compounds) Compound name Aryloxyalkanoic/ Aryloxyphenoxypropionic acid (12)
2,4-D, Clomeprop, Cyhalofop-butyl, Diclofop-methyl, Fenoxaprop-p-ethyl, Haloxyfop, Haloxyfop-R-Methyl, MCPA, Mecoprop-P, Metamifop, Propaquizafop, Quizalofop-ethyl
Avermectin/ Spinosyn
(11)
Abamectin B1a, Emamectin B1a, Emamectin B1b, Lepimectin A3, Lepimectin A4, Milbemectin A3, Milbemectin A4,
Spinetoram (XDE-175-J), Spinetoram (XDE-175-L), Spinosyn A, Spinosyn D
Carbamate
(42)
Alanycarb, Aldicarb, Asulam, Bendiocarb, Benfuracarb, Benthiavalicarb-isopropyl, Butocarboxim, Carbaryl, Carbofuran, Carbosulfan, Cycloate, Dazomet, Di-allate, Diethofencarb, Dimepiperate, Esprocarb, Ethiofencarb, Fenobucarb (BPMC), Fenothiocarb, Fenoxycarb, Furathiocarb, Iprovalicarb, Isoprocarb, Methiocarb, Methomyl, Metolcarb, Molinate, Oxamyl, Pebulate, Phenmedipham, Pirimicarb, Promecarb, Propamocarb, Propham, Propoxur, Pyributicarb, Thiobencarb, Thiodicarb, Tri-allate, Trimethacarb, Vernolate, XMC
Imidazolinone
(5)
Fenamidone, Imazamox, Imazapic, Imazaquin, Imazethapyr
Neonicotinoid
(7)
Acetamiprid, Clothianidin, Dinotefuran, Imidacloprid, Nitenpyram, Thiacloprid, Thiamethoxam
Organophosphate
(64)
Acephate, Anilofos, Azamethiphos, Azinphos-ethyl, Azinphos-methyl, Bensulide, Cadusafos, Carbophenothion, Chlorfenvinphos, Chlorpyrifos, Chlorpyrifos-methyl, Demeton-S-methyl, Diazinon, Dichlorvos, Dicrotophos, Dimethoate, Dimethylvinphos, Edifenphos, EPN, Ethion, Ethoprophos, Etrimfos, Fenamiphos, Fenthion, Fonofos,
Fosthiazate, Imicyafos, Iprobenfos, Isazofos, Isoxathion, Malathion, Mecarbam, Methamidophos, Methidathion, Mevinphos,
Monocrotophos, Omethoate, Oxydemeton-methyl, Parathion, Phenthoate, Phorate, Phosalone, Phosmet, Phosphamidon, Phoxim, Piperophos, Pirimiphos-ethyl, Pirimiph;os-methyl, Profenofos, Prothiofos, Pyraclofos, Pyrazophos, Pyridaphenthion, Quinalphos, Sulprofos, Tebupirimfos, Terbufos, Tetrachlorvinphos, Thiometon, Tolclofos-methyl, Triazophos, Tribufos, Trichlorfon, Vamidothion
Pyrethroid
(14)
Bifenthrin, Cycloprothrin, Cyhalothrin-lambda, Cypermethrin, Deltamethrin, Etofenprox, Fenpropathrin, Fenvalerate, Flucythrinate, Fluvalinate, Halfenprox, Permethrin, Phenothrin, Tralomethrin
Strobilurin
(8)
Azoxystrobin, Fluacrypyrim, Kresoxim-methyl, Metominostrobin, Orysastrobin, Picoxystrobin, Pyraclostrobin, Trifloxystrobin
Triazine
(12)
Ametryn, Atrazine, Cyanazine, Dimethametryn, Hexazinone, Metribuzin, Prometryn, Propazine, Simazine, Simetryn, Terbuthylazine, Terbutryn
Triazole
(26)
Amisulbrom, Azaconazole, Bitertanol, Cafenstrole, Carfentrazone-ethyl, Cyproconazole, Difenoconazole, Diniconazole, Epoxiconazole, Fenbuconazole, Fluquinconazole, Flusilazole, Hexaconazole, Imibenconazole, Metconazole, Myclobutanil, Paclobutrazol, Penconazole, Propiconazole, Simeconazole, Tebuconazole, Tetraconazole, Triadimefon, Triadimenol, Triticonazole, Uniconazole
29 Table 2. (Continued) Chemical group (No. of compounds) Compound Name Urea (34)
Azimsulfuron, Bensulfuron-methyl, Chlorfluazuron,
Chlorimuron-ethyl, Chlorotoluron, Chlorsulfuron, Cyclosulfamuron, Daimuron, Diafenthiuron, Diflubenzuron, Diuron,
Ethametsulfuron-methyl, Ethoxysulfuron, Flucetosulfuron, Flufenoxuron, Forchlorfenuron, Halosulfuron-methyl,
Hexaflumuron, Imazosulfuron, Isoproturon, Linuron, Lufenuron, Metazosulfuron, Methabenzthiazuron, Metobromuron, Nicosulfuron, Novaluron, Pencycuron, Rimsulfuron, Teflubenzuron, Thidiazuron, Thifensulfuron-methyl, Tribenuron-methyl, Triflumuron
Others/ Unclassified
(144)
Acibenzolar-S-methyl, Alachlor, Allidochlor, Ametoctradin, Amitraz, Benfuresate, Bentazone, Benzobicyclon, Benzoximate, Bifenazate, Bifenox, Boscalid, Bromacil, Bromobutide, Bromoxynil, Bupirimate, Buprofezin, Butachlor, Butafenacil, Carbendazim, Carboxin, Carpropamid, Cartap, Chinomethionat,
Chlorantraniliprole, Chloridazon, Chromafenozide, Cinmethylin, Clethodim, Clofentezine, Clomazone, Cyazofamid, Cyflufenamid, Cymoxanil, Cyprodinil, Cyromazine, Diflufenican, Dimethachlor, Dimethenamid, Dimethomorph, Diphenamid, Diphenylamine, Dithiopyr, Ethaboxam (EBX), Ethoxyquin, Etoxazole, Famoxadone, Fenarimol, Fenazaquin, Fenhexamid, Fenoxanil, Fenpyroximate, Fentrazamide, Ferimzone, Fipronil, Flonicamid, Fluazinam, Flubendiamide, Fludioxonil, Flufenacet, Flumiclorac-pentyl, Flumioxazin, Fluopicolide, Fluopyram, Flusulfamide, Flutolanil, Fluxapyroxad, Hexythiazox, Imazalil, Inabenfide, Indanofan, Indoxacarb, Iprodione, Isoprothiolane, Isopyrazam, Lactofen, Mandipropamid, Mefenacet, Mefenpyr-diethyl, Mepanipyrim, Mepronil, Metalaxyl, Methoxyfenozide, Metolachlor, Metrafenone, Napropamide, Nitrapyrin, Nuarimol, Ofurace, Oxadiazon, Oxadixyl, Oxaziclomefone, Pendimethalin, Penoxsulam, Penthiopyrad, Picolinafen, Pretilachlor, Probenazole, Prochloraz, Propachlor, Propanil, Propisochlor, Propyzamide, Pymetrozine, Pyrazolynate, Pyrazoxyfen, Pyribenzoxim, Pyridaben, Pyridalyl, Pyridate, Pyrifenox, Pyrifluquinazon, Pyrimethanil, Pyrimidifen, Pyriminobac-methyl E, Pyriminobac-methyl Z, Pyrimisulfan, Pyriproxyfen, Pyroquilon, Quinmerac, Quinoclamine, Saflufenacil, Sethoxydim, Spirodiclofen, Spirotetramat, Sulfoxaflor, TCMTB, Tebufenozide, Tebufenpyrad,
TFNA [4-trifluoromethyl nicotinic acid], Thenylchlor,
Thiabendazole, Thiazopyr, Thifluzamide, Thiocyclam, Thiophanate-methyl, Tiadinil, Tolfenpyrad, Tolylfluanid, Triclopyr, Tricyclazole, Triflumizole, Trifluralin, Zoxamide
30
Table 3. List of representative chemical groups and 380 pesticides selected for
the final method validation in urine
Chemical group (No. of compounds) Compound name Aryloxyalkanoic/ Aryloxyphenoxy-propionic acid (12)
2,4-D, Clomeprop, Cyhalofop-butyl, Diclofop-methyl, Fenoxaprop-p-ethyl, Haloxyfop, Haloxyfop-R-Methyl, MCPA, Mecoprop-P, Metamifop, Propaquizafop, Quizalofop-ethyl
Avermectin/ Spinosyn
(11)
Abamectin B1a, Emamectin B1a, Emamectin B1b, Lepimectin A3, Lepimectin A4, Milbemectin A3, Milbemectin A4,
Spinetoram (XDE-175-J), Spinetoram (XDE-175-L), Spinosyn A, Spinosyn D
Carbamate (41)
Alanycarb, Asulam, Bendiocarb, Benfuracarb,
Benthiavalicarb-isopropyl, Butocarboxim, Carbaryl, Carbofuran, Carbosulfan, Cycloate, Dazomet, Di-allate, Diethofencarb, Dimepiperate, Esprocarb, Ethiofencarb, Fenobucarb (BPMC), Fenothiocarb, Fenoxycarb, Furathiocarb, Iprovalicarb, Isoprocarb, Methiocarb, Methomyl, Metolcarb, Molinate, Oxamyl, Pebulate, Phenmedipham, Pirimicarb, Promecarb, Propamocarb, Propham, Propoxur, Pyributicarb, Thiobencarb, Thiodicarb, Tri-allate, Trimethacarb, Vernolate, XMC
Imidazolinone (5)
Fenamidone, Imazamox, Imazapic, Imazaquin, Imazethapyr
Neonicotinoid (7)
Acetamiprid, Clothianidin, Dinotefuran, Imidacloprid, Nitenpyram, Thiacloprid, Thiamethoxam
Organophosphate (64)
Acephate, Anilofos, Azamethiphos, ethyl, Azinphos-methyl, Bensulide, Cadusafos, Carbophenothion,
Chlorfenvinphos, Chlorpyrifos, Chlorpyrifos-methyl, Demeton-S-methyl, Diazinon, Dichlorvos, Dicrotophos, Dimethoate, Dimethylvinphos, Edifenphos, EPN, Ethion, Ethoprophos, Etrimfos, Fenamiphos, Fenthion, Fonofos, Fosthiazate, Imicyafos, Iprobenfos, Isazofos, Isoxathion, Malathion, Mecarbam, Methamidophos, Methidathion, Mevinphos, Monocrotophos, Omethoate, Oxydemeton-methyl, Parathion, Phenthoate, Phorate, Phosalone, Phosmet, Phosphamidon, Phoxim, Piperophos, Pirimiphos-ethyl, Pirimiphos-methyl, Profenofos, Prothiofos, Pyraclofos, Pyrazophos, Pyridaphenthion, Quinalphos, Sulprofos, Tebupirimfos, Terbufos, Tetrachlorvinphos, Thiometon, Tolclofos-methyl, Triazophos, Tribufos, Trichlorfon, Vamidothion
Pyrethroid (14)
Bifenthrin, Cycloprothrin, Cyhalothrin-lambda, Cypermethrin, Deltamethrin, Etofenprox, Fenpropathrin, Fenvalerate, Flucythrinate, Fluvalinate, Halfenprox, Permethrin, Phenothrin, Tralomethrin
Strobilurin (8)
Azoxystrobin, Fluacrypyrim, Kresoxim-methyl, Metominostrobin, Orysastrobin, Picoxystrobin, Pyraclostrobin, Trifloxystrobin
Triazine (12)
Ametryn, Atrazine, Cyanazine, Dimethametryn, Hexazinone, Metribuzin, Prometryn, Propazine, Simazine, Simetryn, Terbuthylazine, Terbutryn
Triazole (26)
Amisulbrom, Azaconazole, Bitertanol, Cafenstrole, Carfentrazone-ethyl, Cyproconazole, Difenoconazole, Diniconazole, Epoxiconazole, Fenbuconazole, Fluquinconazole, Flusilazole, Hexaconazole, Imibenconazole, Metconazole, Myclobutanil, Paclobutrazol, Penconazole, Propiconazole, Simeconazole, Tebuconazole, Tetraconazole, Triadimefon, Triadimenol, Triticonazole, Uniconazole