Dependence of Monte Carlo Prediction on Evaluated Nuclear Data Library in Continuous
Energy Criticality Calculations
Ho Jin Park and Chang Hyo Kim
Seoul National University, San 56-1, Shinlim-dong, Kwanak-gu, Seoul Korea pparkko1@snu.ac.kr, kchyo@snu.ac.kr
1. Introduction
Monte Carlo neutronics calculations can estimate accurate nuclear parameters from continuous energy nuclear library and detailed geometry. The continuous energy nuclear library for Monte Carlo simulations can be generated from several evaluated nuclear data files - ENDF/B-VI.8, JENDL-3.3, JEFF-3.0, etc – by NJOY 99 [1]. The objective of this paper is to quantify effects of evaluated nuclear data files on nuclear parameters estimated by Monte Carlo calculations for various critical experiment problems. In this study, Monte Carlo calculations are conducted by the MCCARD [2] which is designed exclusively for the neutron transport calculation.
2. Methods and Results
2.1 Critical experiment problems
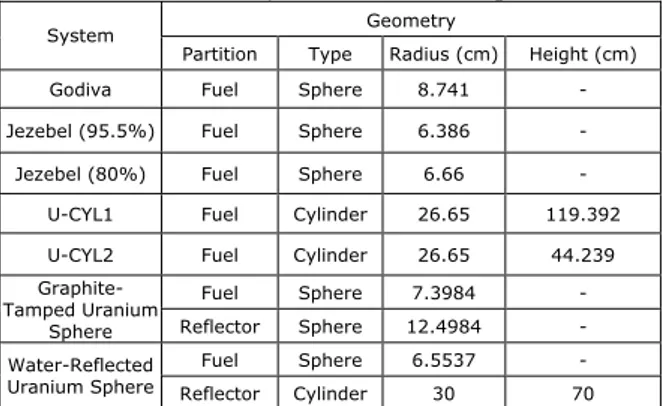
In order to investigate into the dependence of Monte Carlo prediction on evaluated nuclear data libraries, the keff was calculated for seven critical experiments [3] and VENUS critical facility. And the pin power distributions were calculated for the VENUS critical facility. The cases of seven critical experiments were divided into highly enriched uranium (HEU), low-enriched uranium (LEU) and Plutonium critical experiments. The Godiva,, graphite-tamped uranium sphere, water-reflected uranium sphere are HEU. And U-CYL1 and U-CYL2 are LEU. And the others are the Plutonium critical experiment. The specifications for the MCCARD models of each critical experiment except for the VENUS critical facility are shown in Table 1 and Table 2. The exact dimensions and the material compositions of VENUS critical facility are given in reference [4].
Table 1 Geometry data of benchmark problems
Geometry System
Partition Type Radius (cm) Height (cm)
Godiva Fuel Sphere 8.741 -
Jezebel (95.5%) Fuel Sphere 6.386 - Jezebel (80%) Fuel Sphere 6.66 -
U-CYL1 Fuel Cylinder 26.65 119.392 U-CYL2 Fuel Cylinder 26.65 44.239
Fuel Sphere 7.3984 -
Graphite-Tamped Uranium
Sphere Reflector Sphere 12.4984 - Fuel Sphere 6.5537 - Water-Reflected
Uranium Sphere Reflector Cylinder 30 70
Table 2 Material composition of benchmark problems
Material System
Partition Nuclides Mass Density (g/cm3) Mass Fraction (%)
U-234 93.71 U-235 5.27 Godiva Fuel U-238 18.74 1.02 Pu-239 95 Jezebel Fuel Pu-240 15.61 4.5 Pu-239 80 Jezebel Fuel Pu-240 15.73 20 U-235 10.9 U-CYL1 Fuel U-238 18.63 89.1
U-235 14.11 U-CYL2 Fuel U-238 18.41 85.59
U-235 93.5 Fuel U-238 18.6 6.5 C-12 99.5 Fe-32 0.34 Graphite-Tamped Uranium Sphere Reflector S-Nat. 1.67 0.16 U-234 0.00053 U-235 0.04703 U-236 0.0001 Fuel U-238 0.04815 0.00049 H-1 0.06679 Water-Reflected Uranium Sphere Reflector O-16 0.100019 0.0334 2.2 Results
The number of histories of all Monte Carlo calculations was 5
×
102 cycles with 5×
104 particles per cycle. The temperature of experiments was 300Κ
o.The results of the calculations using the MCCARD with the JENDL-3.3, JEFF-3.0 and ENDF/B-VI.8 libraries are shown in Figure 1. Each result has been compared with the experimental values. The ENDF/B-VI results agree well with the JEFF-3.0 results for HEU and VENUS. But the JENDL-3.3 result shows a difference of a maximum 800 pcm for the others.
-25 -20 -15 -10 -5 0 5 10 15 20 25 VE NU S w a ter-re flected ur ani u m sph ere G rap hi te d-tam ped ur ani um sphe re CY L-2 CY L-1 Jez ebel 80% Je zebel 95. 5% GO DIV A D iff er ence of k-eff ( m k) ENDF/B-VI.8 JENDL-3.3 JEFF-3.0
Figure 1.Comparisons of calculated keff with experiments
Transactions of the Korean Nuclear Society Autumn Meeting Busan, Korea, October 27-28, 2005
For Plutonium critical experiments, Difference between the JEFF-3.0 results and the others are of maximum 600 pcm, but the results using ENDF/B-VI.8 and JENDL-3.3 are almost identical. For LEU critical experiments, the ENDF/B-VI results approximate experimental values, but the JENDL-3.3 and JEFF-3.0 results is different in maximum 1700 pcm for the ENDF/B-VI.8 results.
Figure 2.VENUS Critical Facility
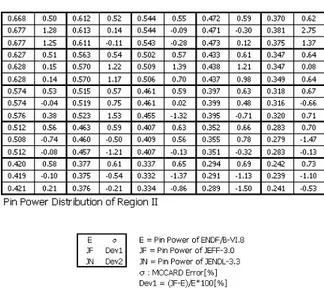
The pin power distributions have been measured at VENUS critical facility. The calculated power distributions of Region I and Region II are shown in Figure 3 and Figure 4. The deviation from the measured values are represented in the form of 100(J-E)/E, where E is the ENDF/B-VI.8 results, where J is the JENDL-3.3 or JEFF-3.0 results. The average deviation between ENDF/B-VI.8 and JENDL-3.3 was calculated as 0.65%
±
0.43%. As a whole, most of results show less than 2.30% deviation with JENDL-3.3 results. The average deviation between ENDF/B-VI.8 and JEFF-3.0 was calculated as 0.64%±
0.43%. And most of results show less than 2.75% deviation with JEFF-3.0 results.Figure 4.Pin Power Distributions of VENUS region I
Figure 4.Pin Power Distributions of VENUS region II
3. Conclusion
The Monte Carlo calculations using ENDF/B-VI.8 and JENDL-3.3 and JEFF-3.0 were performed with the MCCARD for seven critical experiments and VENUS critical facility. In results, it is demonstrated that the keff of critical experiments on evaluated nuclear data libraries are different in maximum 1700 pcm. And the pin power distributions of VENUS critical facility showed good agreement on evaluated nuclear data libraries.
REFERENCES
[1] R. E. MacFarlace and D. M. Muir, “The NJOY Nuclear Data Processing System, Version 91,”LANL report LA-12740M
[2] Chang Sun Jang, Chang Hyo Kim, etc, “Monte Carlo Code Development for Nuclear Core Analysis,” KAERI/CM-312/99, 2000
[3] Daniel J. Whalen, et al., “MCNP: Neutron Benchmark Problems,” LANL, LA-12212, 1991
[4] P. O. Morakinyo, M. L. Williams, “Analysis of the VENUS PWR Engineering Mockup Experiment – Phase I: Source Dirstribution,”NUREG/CR-3888, 1984