Corresponding author: Jun Ho Lee
Department of Clinical Laboratory Science, Wonkwang Health Science University, 514 Iksan-daero, Iksan 54538, Korea
E-mail: [email protected]
ORCID: https://orcid.org/0000-0003-0641-6528 ORIGINAL ARTICLE
Relationship between Hypertension and the Declining
Renal Function in Korean Adults
Jun Ho Lee
Department of Clinical Laboratory Science, Wonkwang Health Science University, Iksan, Korea
한국 성인에서 고혈압과 신기능 저하와의 관련성
이준호
원광보건대학교 임상병리과
ARTICLE INFO ABSTRACT
Received February 4, 2021 Revised February 21, 2021 Accepted March 1, 2021
This study examined the association between hypertension (HTN), estimated glomerular filtration rate (eGFR), and urine microalbumin/creatinine ratio (ACR) in Korean adults. Data for 8,922 adults (3,941 men and 4,981 women) aged ≥20 years from the Sixth Korean National Health and Nutrition Examination Survey VI (2013∼2014) were analyzed. In men, after adjusting for the related variables, the odds ratios (ORs) of HTN [systolic blood pressure (SBP) ≥140 mmHg, diastolic blood pressure (DBP) ≥90 mmHg, or use of HTN medications] were significantly higher in the decreased eGFR group [eGFR <60 mL/min/1.73 m2, 1.98 (95% CI, 1.21∼3.24)], elevated ACR group [ACR ≥30 mg/g, 2.03 (95% CI, 1.54∼2.69)], and decreased eGFR plus elevated ACR group [eGFR <60 mL/min/1.73 m2 and ACR ≥30 mg/g, 6.03 (95% CI, 2.82∼12.92)] than in the normal group (eGFR ≥60 mL/min/1.73 m2 and ACR <30 mg/g). In women, after adjusting for the related variables, the ORs of HTN were significantly higher in the decreased eGFR group (2.29, 95% CI, 1.27∼4.13), elevated ACR group (2.22, 95% CI, 1.68∼2.94), and decreased eGFR plus elevated ACR group (10.77, 95% CI, 3.89∼29.82) than the normal group. In conclusion, HTN was associated with a decreased eGFR and elevated ACR in Korean men and women. In addition, the prevalence of HTN increased greatly when a decreased eGFR and elevated ACR occurred simultaneously.
Copyright Ⓒ 2021 The Korean Society for Clinical Laboratory Science. All rights reserved.
Key words Hypertension
Estimated glomerular filtration rate Urine microalbumin/creatinine ratio Chronic kidney disease
Albuminuria
INTRODUCTION
Chronic kidney disease (CKD) is a major global public health problem [1]. The prevalence of CKD is 10 to 16% among the adult population in Asia, Europe, and the USA [2-4]. CKD is defined as estimated glomerular filtration rate (eGFR) <60 mL/min/1.73 m2 and is known to be a major cause of cardiovascular disease
(CVD) and all-cause mortality [5, 6]. Hypertension (HTN) is defined as SBP ≥140 mmHg or DBP ≥90 mmHg or use of HTN medications [7]. Hypertension (HTN) and CKD are important independent risk factors for CVD [7]. In particular, HTN is highly prevalent in populations with end stage renal disease (ESRD) receiving hemodialysis [8, 9].
Albuminuria is known as a strong risk factor for CVD including hypertension, ischemic heart disease, and stroke and increases the risks of all-cause and cardiovascular mortality and morbidity [10, 11]. An increase in the urine microalbumin/creatinine ratio Korean Society for
(ACR) is an important predictor for the progression of diabetic nephropathy (DN) [12]. In particular, it is important to monitor ACR in populations with CKD. Some studies have suggested that CVD mortality and the prevalence of ESRD increase greatly when CKD and albuminuria occur simultaneously [13, 14]. Therefore, our objective in this study was to assess the association of HTN with eGFR and ACR in Korean adults using data from the Sixth Korean National Health and Nutrition Examination Survey (KNHANES VI; 2013∼2014), which is representative of the Korean population.
MATERIALS AND METHODS
1. Study subjects
This study was performed using data from the Sixth Korean National Health and Nutrition Examination Survey (KNHANES VI). KNHANES VI were each conducted for 2 years (2013∼2014), using a rolling sampling survey that involved a complex, stratified, multistage, probability cluster survey of a representative sample of the non-institutionalized civilian population in South Korea. The survey was composed of three parts: a health interview survey, a health examination survey, and a nutrition survey. Each survey was conducted by specially trained interviewers. The interviewers were not provided with any prior information regarding specific participants before conducting the interviews. Participants provided written informed consent to participate in this survey, and we received the data in anonymized form. In the KNHANES VI (2013∼2014), 15,568 individuals over age 1 were sampled for the survey. Among them, of the 11,925 subjects who parti-cipated in the KNHANES VI, we limited the analyses to adults aged ≥20 years. We excluded participants 3,003 subjects whose data were missing for important analytic variables, such as blood pressure, urine micro-albumin and creatinine level, and various blood chemistry tests. Finally, 8,922 adults (3,941 men and 4,981 women) subjects were included in the statistical analysis. The KNHANES VI study has been conducted
according to the principles expressed in the Decla-ration of Helsinki (Institutional Review Board No, 2013-07CON-03-4C; 2013-12EXP-03-5C). All partici-pants in the survey signed an informed written consent form. Further information can be found in “The KNHANES VI Sample”, which is available on the KNHANES website. The data from KNHANES is available on request by email if the applicant logs onto the “Korea National Health and Nutrition Examination Survey” website.
2. General characteristics and blood chemistry
Research subjects were classified by sex (men or women). Anthropometric measurements included measurement of body mass index (BMI) and waist circumference (WC), as well as final measurements of systolic blood pressure (SBP) and diastolic blood pressure (DBP). Blood chemistries included measurements of total cholesterol (TC), high density lipoprotein cholesterol (HDL-C), triglycerides (TGs), fasting blood glucose (FBG), blood urea nitrogen (BUN), serum creatinine (SCr), urine microalbumin, and urine creatinine (UCr).
3. Glomerular filtration rate and urine microalbumin and hypertension
Adult GFR was estimated from the simplified equation developed using the Chronic Kidney Disease Epidemiology Collaboration (CKD-EPI) equation: GFR= 141×min (SCr/κ, 1) α×max (Scr/κ,1)−1.209×0.993 Age×1.018 [if female]×1.159 [if black], where SCr indicates serum creatinine and κ is a correction factor, defined as follows: → 0.7 if women and → 0.9 if men [15]. The decreased eGFR was classified as eGFR <60 mL/min/ 1.73 m2 [15]. Urine microalbumin was measured with a turbidimetric assay (Albumin; Roche, Germany) using a Hitachi Automatic Analyzer 7600 (Hitachi, Tokyo, Japan). The 99 creatinine was measured with a colorimetric assay (CREA; Roche, USA) using a Hitachi Automatic Analyzer 7600 (Hitachi, Tokyo, Japan). The elevated ACR was classified as ACR ≥30 mg/g [13]. HTN
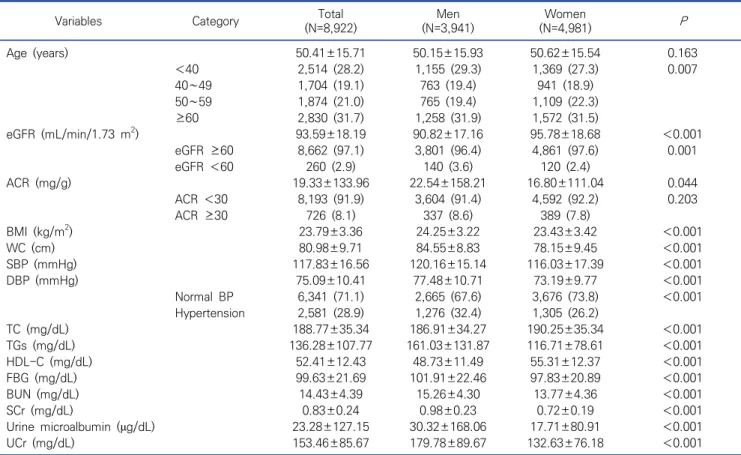
Table 1. Clinical characteristics of research subjects N (%), M±SD
Variables Category (N=8,922)Total (N=3,941)Men (N=4,981)Women P
Age (years) 50.41±15.71 50.15±15.93 50.62±15.54 0.163 <40 2,514 (28.2) 1,155 (29.3) 1,369 (27.3) 0.007 40∼49 1,704 (19.1) 763 (19.4) 941 (18.9) 50∼59 1,874 (21.0) 765 (19.4) 1,109 (22.3) ≥60 2,830 (31.7) 1,258 (31.9) 1,572 (31.5) eGFR (mL/min/1.73 m2) 93.59±18.19 90.82±17.16 95.78±18.68 <0.001 eGFR ≥60 8,662 (97.1) 3,801 (96.4) 4,861 (97.6) 0.001 eGFR <60 260 (2.9) 140 (3.6) 120 (2.4) ACR (mg/g) 19.33±133.96 22.54±158.21 16.80±111.04 0.044 ACR <30 8,193 (91.9) 3,604 (91.4) 4,592 (92.2) 0.203 ACR ≥30 726 (8.1) 337 (8.6) 389 (7.8) BMI (kg/m2) 23.79±3.36 24.25±3.22 23.43±3.42 <0.001 WC (cm) 80.98±9.71 84.55±8.83 78.15±9.45 <0.001 SBP (mmHg) 117.83±16.56 120.16±15.14 116.03±17.39 <0.001 DBP (mmHg) 75.09±10.41 77.48±10.71 73.19±9.77 <0.001 Normal BP 6,341 (71.1) 2,665 (67.6) 3,676 (73.8) <0.001 Hypertension 2,581 (28.9) 1,276 (32.4) 1,305 (26.2) TC (mg/dL) 188.77±35.34 186.91±34.27 190.25±35.34 <0.001 TGs (mg/dL) 136.28±107.77 161.03±131.87 116.71±78.61 <0.001 HDL-C (mg/dL) 52.41±12.43 48.73±11.49 55.31±12.37 <0.001 FBG (mg/dL) 99.63±21.69 101.91±22.46 97.83±20.89 <0.001 BUN (mg/dL) 14.43±4.39 15.26±4.30 13.77±4.36 <0.001 SCr (mg/dL) 0.83±0.24 0.98±0.23 0.72±0.19 <0.001 Urine microalbumin (μg/dL) 23.28±127.15 30.32±168.06 17.71±80.91 <0.001 UCr (mg/dL) 153.46±85.67 179.78±89.67 132.63±76.18 <0.001
Abbreviations: eGFR, estimated glomerular filtration rate ACR, Urine microalbumin/creatinine ratio; BMI, body mass index; WC, waist circumference; SBP, systolic blood pressure; DBP, diastolic blood pressure; Hypertension, SBP≥140 mmHg or DBP≥90 mmHg or use of hypertension medications; TC, total cholesterol; TGs, triglycerides; HDL-C, high density lipoprotein cholesterol; FBG, fasting blood glucose; BUM, blood urea nitrogen; SCr, serum creatinine; UCr, urine creatinine.
was classified as SBP ≥140 mmHg or DBP ≥90 mmHg or use of HTN medications [7].
4. Statistical analysis
The collected data were statistically analyzed using SPSS WIN version 18.0 (SPSS Inc., Chicago, IL, USA). In statistical analyses, continuous variables were reported as mean±standard deviation (M±SD). Clinical charac-teristics according to men and women were analyzed using chi-square and an independent t-test (see Table 1). Clinical characteristics according to the normal, decreased eGFR, elevated ACR, and decreased eGFR plus elevated ACR in men (see Table 2) and women (see Table 3) were calculated using chi-squared and an analysis of variance test (ANOVA). We conducted correlation analysis for SBP and DBP in men and women (see Table 4). In the case of logistic regression
for odds ratio of HTN in men and women (see Table 5), the 4 models constructed were: 1) non-adjusted; 2) adjusted for age; 3) further adjusted for BMI and WC; 4) further adjusted for TC, TGs, HDL-C, and FBG. The significance level for all of the statistical data was set as P<0.05.
RESULTS
1. Clinical characteristics of research subjects
The clinical characteristics of the research subjects are shown in Table 1. In men (N =3,941), eGFR, ACR, SBP, and DBP were 90.82±17.16 mL/min/1.73 m2, 22.54±158.21 mg/g, 120.16±15.14 mmHg, and 77.48± 10.71 mmHg, respectively. The prevalence rates of decreased eGFR, elevated ACR, and HTN were 3.6% (N=140), 8.6% (N=337), and 32.4% (N=1,276), respectively.
Table 2. Clinical characteristics of subjects according to the normal, decreased eGFR, elevated ACR, and decreased eGFR plus elevated
ACR in men (N=3,941)
Variables (N=3,520)Normal Decreased eGFR(N=84) Elevated ACR(N=281) Decreased eGFR plus elevated ACR (N=56) P
Age (years) 48.79±15.66 68.43±8.66 58.31±13.86 67.00±11.84 <0.001 SBP (mmHg) 119.13±14.32 119.86±13.43 131.23±19.09 130.18±19.11 <0.001 DBP (mmHg) 77.39±10.28 71.26±9.94 80.96±14.18 74.66±12.35 <0.001 Hypertension 1,006 (28.6) 55 (65.5) 168 (59.8) 47 (83.9) <0.001 BMI (kg/m2) 24.18±3.15 24.28±2.82 25.05±3.96 24.84±3.54 <0.001 WC (cm) 84.21±8.64 86.72±8.01 87.57±10.52 87.56±10.52 <0.001 TC (mg/dL) 187.03±34.57 176.24±34.30 191.32±41.28 173.59±41.87 <0.001 TGs (mg/dL) 157.33±126.21 158.73±91.76 210.80±194.97 147.63±81.07 <0.001 HDL-C (mg/dL) 49.21±11.49 43.70±10.46 47.81±11.50 42.71±9.62 <0.001 FBG (mg/dL) 100.13±19.97 105.00±25.75 119.91±35.46 119.30±32.39 <0.001 BUN (mg/dL) 14.94±3.84 20.94±6.42 15.54±4.35 25.07±7.91 <0.001 SCr (mg/dL) 0.95±0.12 1.45±0.23 0.95±0.15 1.81±1.19 <0.001 eGFR (mL/min/1.73 m2) 92.46±15.14 52.80±7.46 90.52±18.99 46.66±12.10 <0.001 ACR (mg/g) 5.24±5.31 8.51±7.56 149.50±261.70 493.87±1055.69 <0.001 Urine microalbumin (μg/dL) 9.61±11.18 13.33±14.42 210.32±396.49 454.11±915.64 <0.001 UCr (mg/dL) 184.19±90.57 148.59±74.45 145.72±74.21 120.45±49.99 <0.001
Abbreviations: Normal, eGFR≥60 mL/min/1.73 m2 and ACR<30 mg/g; Decreased eGFR, eGFR<60 mL/min/1.73 m2; Elevated ACR, ACR≥30 mg/g; Decreased eGFR plus Elevated ACR, eGFR<60 mL/min/1.73 m2 and ACR≥30 mg/g. Hypertension, SBP≥140 mmHg or DBP≥90 mmHg or use of hypertension`n medications.
Table 3. Clinical characteristics of subjects according to the normal, decreased eGFR, elevated ACR, and decreased eGFR plus elevated
ACR in women (N=4,981)
Variables (N=4,516)Normal Decreased eGFR(N=76) Elevated ACR(N=345) Decreased eGFR plus Elevated ACR (N=44) P
Age (years) 49.64±15.21 72.18±6.94 56.71±15.57 65.57±13.49 <0.001 SBP (mmHg) 114.82±16.62 125.17±17.66 127.73±20.13 133.09±22.92 <0.001 DBP (mmHg) 72.94±9.51 70.93±11.76 76.75±10.86 74.70±15.48 <0.001 Hypertension 1,033 (22.9) 59 (77.6) 175 (50.7) 38 (86.4) <0.001 BMI (kg/m2) 23.30±3.34 25.02±3.30 24.56±4.04 24.60±4.11 <0.001 WC (cm) 77.71±9.22 84.24±9.23 81.91±10.62 83.77±10.88 <0.001 TC (mg/dL) 189.83±35.05 190.87±41.94 196.72±36.63 180.66±37.11 0.001 TGs (mg/dL) 114.20±77.74 150.05±83.81 139.01±82.70 141.91±82.60 <0.001 HDL-C (mg/dL) 55.63±12.34 49.03±11.87 53.08±11.93 51.16±14.74 <0.001 FBG (mg/dL) 96.63±18.32 105.64±18.24 110.18±39.04 110.14±29.71 <0.001 BUN (mg/dL) 13.53±3.90 20.05±7.28 14.12±4.04 25.50±12.82 <0.001 SCr (mg/dL) 0.71±0.10 1.09±0.13 0.71±0.11 1.57±1.41 <0.001 eGFR (mL/min/1.73 m2) 97.10±17.25 53.57±5.99 94.14±19.39 45.71±13.82 <0.001 ACR (mg/g) 6.40±5.69 8.20±7.02 113.32±266.00 358.09±810.03 <0.001 Urine microalbumin (μg/dL) 8.68±9.52 10.27±15.57 104.35±163.85 277.73±628.81 <0.001 UCr (mg/dL) 134.84±76.58 111.41±76.87 113.93±69.14 89.34±42.01 <0.001
Abbreviation: See Table 2.
In women (N=4,981), eGFR, ACR, SBP, and DBP were 95.78±18.68 mL/min/1.73 m2, 16.80±111.04 mg/g, 116.03±17.39 mmHg, and 73.19±9.77 mmHg, respec-tively. The prevalence rates of decreased eGFR, elevated ACR, and HTN were 2.4% (N=120), 7.8% (N=389), and 26.2% (N=1,305), respectively.
2. Clinical characteristics of subjects according to the normal, decreased eGFR, elevated ACR, and decreased GFR plus elevated ACR in men and women
The clinical characteristics of the subjects according to the normal, decreased eGFR and elevated ACR in
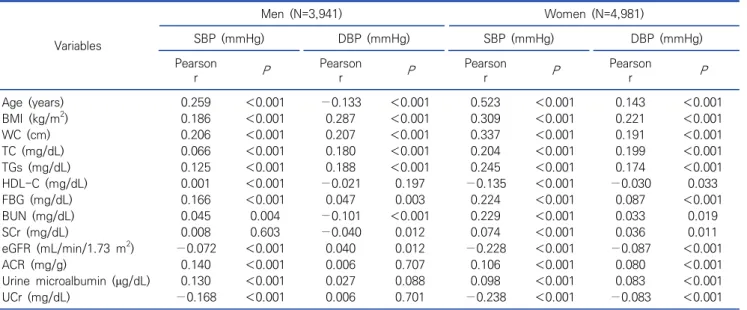
Table 4. Correlation analysis for SBP and DBP in men and women (N=8,922) Variables Men (N=3,941) Women (N=4,981) SBP (mmHg) DBP (mmHg) SBP (mmHg) DBP (mmHg) Pearson r P Pearson r P Pearson r P Pearson r P Age (years) 0.259 <0.001 −0.133 <0.001 0.523 <0.001 0.143 <0.001 BMI (kg/m2) 0.186 <0.001 0.287 <0.001 0.309 <0.001 0.221 <0.001 WC (cm) 0.206 <0.001 0.207 <0.001 0.337 <0.001 0.191 <0.001 TC (mg/dL) 0.066 <0.001 0.180 <0.001 0.204 <0.001 0.199 <0.001 TGs (mg/dL) 0.125 <0.001 0.188 <0.001 0.245 <0.001 0.174 <0.001 HDL-C (mg/dL) 0.001 <0.001 −0.021 0.197 −0.135 <0.001 −0.030 0.033 FBG (mg/dL) 0.166 <0.001 0.047 0.003 0.224 <0.001 0.087 <0.001 BUN (mg/dL) 0.045 0.004 −0.101 <0.001 0.229 <0.001 0.033 0.019 SCr (mg/dL) 0.008 0.603 −0.040 0.012 0.074 <0.001 0.036 0.011 eGFR (mL/min/1.73 m2) −0.072 <0.001 0.040 0.012 −0.228 <0.001 −0.087 <0.001 ACR (mg/g) 0.140 <0.001 0.006 0.707 0.106 <0.001 0.080 <0.001 Urine microalbumin (μg/dL) 0.130 <0.001 0.027 0.088 0.098 <0.001 0.083 <0.001 UCr (mg/dL) −0.168 <0.001 0.006 0.701 −0.238 <0.001 −0.083 <0.001
Table 5. Comparisons of hypertension odds ratio according to the normal, decreased eGFR, elevated ACR, and decreased eGFR plus
elevated ACR in men and women (N=8,922)
Gender Variables Hypertension
Model 1 Model 2 Model 3 Model 4
Men (N=3,941) Normal 1 1 1 1
Decreased eGFR 4.74 (3.01∼7.48) 2.08 (1.30∼3.33) 1.88 (1.16∼3.05) 1.98 (1.21∼3.24)
Elevated ACR 3.72 (2.90∼4.77) 2.71 (2.09∼3.53) 2.34 (1.78∼3.07) 2.03 (1.54∼2.69)
Decreased eGFR plus elevated ACR
13.05 (6.37∼26.73) 6.71 (3.21∼14.06) 5.84 (2.75∼12.39) 6.03 (2.82∼12.92)
Women (N=4,981) Normal 1 1 1 1
Decreased eGFR 11.70 (6.79∼20.16) 2.50 (1.41∼4.43) 2.32 (1.30∼4.15) 2.29 (1.27∼4.13)
Elevated ACR 3.47 (2.78∼4.34) 2.71 (2.08∼3.54) 2.41 (1.83∼3.16) 2.22 (1.68∼2.94)
Decreased eGFR plus elevated ACR
21.35 (9.00∼50.66) 12.59 (4.69∼33.81) 12.56 (4.51∼34.99) 10.77 (3.89∼29.82) Abbreviation: See Table 2.
Model 1 (OR, 95% CI), Non-adjusted; Model 2 (OR, 95% CI), adjusted for age; Model 3 (OR, 95% CI), Model 2 further adjusted for BMI and WC; Model 4 (OR, 95% CI), Model 3 further adjusted for TC, TGs, HDL-C, and FBG.
men and women are shown in Tables 2 and 3. In men, SBP and DBP were 119.13±14.32 mmHg and 77.39± 10.28 mmHg for the normal group, 119.86±13.43 mmHg and 71.26±9.94 mmHg for the decreased eGFR group, 131.23±19.09 mmHg and 80.96±14.18 mmHg for the elevated ACR group, and 130.18±19.11 mmHg and 74.66±12.35 mmHg for the decreased eGFR plus elevated ACR group, respectively (Table 2). In women, SBP and DBP were 114.82±16.62 mmHg and 72.94± 9.51 mmHg for the normal group, 125.17±17.66 mmHg and 70.93±11.76 mmHg for the decreased eGFR group, 127.73±20.13 mmHg and 76.75±10.86 mmHg for the
elevated ACR group, and 133.09±22.92 mmHg and 74.70±15.48 mmHg for the decreased eGFR plus elevated ACR group, respectively (Table 3).
3. Correlation analysis for SBP and DBP in men and women
Correlation analysis results for SBP and DBP in men and women are shown in Table 4. In men, the variables that positively correlated with SBP were age, BMI, WC, TC, TGs, FBG, BUN ACR, and urine microalbumin, and variables that inversely correlated with SBP were eGFR and urine creatinine (UCr). Variables that positively
correlated with DBP were age, BMI, WC, TC, TGs, and FBG, and those that inversely correlated with DBP were BUN, SCr, and eGFR. In women, variables that positively correlated with both SBP and DBP were age, BMI, WC, TC, TGs, FBG, BUN, SCr, ACR, and urine microalbumin, and those that inversely correlated with both SBP and DBP were HDL-C, eGFR, and UCr. 4. Comparison of HTN odds ratios according to the
decreased eGFR, elevated ACR, and decreased GFR plus elevated ACR in men and women
The comparisons of HTN odds ratios (ORs) according to the normal, decreased eGFR, elevated ACR, and decreased eGFR plus elevated ACR in men and women are shown in Table 5. In men, after adjusting for related variables (age, BMI, WC, TC, TGs, HDL-C, and FBG), the ORs of HTN were significantly higher in the decreased eGFR group (1.98, 95% CI, 1.21∼3.24), elevated ACR group (2.03, 95% CI, 1.54∼2.69), and decreased eGFR plus elevated ACR group (6.03, 95% CI, 2.82∼12.92) than in the normal group. In women, after adjusting for related variables, the ORs of HTN were significantly higher in the decreased eGFR group (2.29, 95% CI, 1.27∼4.13), elevated ACR group (2.22, 95% CI, 1.68∼ 2.94), and decreased eGFR plus elevated ACR group (10.77, 95% CI, 3.89∼29.82) than in the normal group (Table 5).
DISCUSSION
The present study investigated the association between hypertension, eGFR, and ACR in Korean adults using data from the sixth KNHANES conducted in 2013 ∼2014. HTN was associated with decreased eGFR and elevated ACR in Korean men and women. In addition, the prevalence of HTN increased greatly when decreased eGFR and elevated ACR occurred simultaneously.
The prevalence of CKD worldwide varies by age, gender, country, and ethnicity [16]. In the International Collaborative Study of Cardiovascular Disease in Asia (InterASIA), the prevalence of CKD in Chinese women
(3.8%) was higher than that in Chinese men (1.3%) [17]. Shankar et al. reported that the prevalence of CKD in Singaporean women (6.2%) was lower than that in Singaporean men (7.1%) [18]. In the present study, the prevalence of CKD in women (2.4%) was lower than that in men (3.6%).
Cardiovascular risk such as hypertension progressively increases as renal function declines [19] and renal function decline is associated with albuminuria [20]. In the relationship between CKD, albuminuria, and HTN, the renin-angiotensin-aldosterone system (RAAS) may be a mediator. Angiotensin II has a vasoconstrictor effect on the post glomerular arterioles, and can contribute to the onset and progression of chronic renal damage [21]. The damaged renal function can lead to poor blood pressure control due to renin–angiotensin activation [22]. Patients with HTN experience remodeling of blood vessels due to RAAS, inflammation, and endothelial dysfunction [23]. Structural and functional remodeling of the blood vessel affects glomerular basement membranes and leads to glomerular barrier permeability, which may result in albuminuria [24, 25]. Most studies have reported that angiotensin-converting enzyme inhibitors and angiotensin II receptor blockers, which are effective in the treatment of hypertension, reduce the risk of ESRD in patients with albuminuria or CKD [26-29].
In the present study, the ORs for HTN, with the normal group as a reference, were significantly higher in the decreased eGFR group (men, 1.98, 95% CI, 1.21∼ 3.24; women, 2.29, 95% CI, 1.27∼4.13) and elevated ACR group (men, 2.03, 95% CI, 1.54∼2.69; women, 2.22, 95% CI, 1.68∼2.94). In addition, the ORs for HTN were markedly higher when eGFR decreased and ACR increased simultaneously (men, 6.03, 95% CI, 2.82∼ 12.92; women, 10.77, 95% CI, 3.89∼29.82). The early stages of CKD can cause HTN and potentiate the risk for CVD [30]. The risk of developing congestive heart failure and atrial fibrillation is increased two fold in patients with CKD (eGFR <60 mL/min/1.73 m2) [31, 32]. An increase of ACR is an important biomarker for
cardiovascular events and renal events and mortality [33]. In the Framingham Offspring Study performed with participants free of HTN and diabetes mellitus, individuals with ACR greater than the sex-specific median (7.5 g/mg for women, 3.9 g/mg for men) had a nearly three-fold risk of developing CVD (hazard ratio [HR], 2.92; 95% CI, 1.57∼5.44; P<0.001) compared to those with ACR below the median [34]. In the Heart Outcomes Prevention Evaluation (HOPE) study, microalbuminuria was significantly related to major cardiovascular events (relative risk [RR], 1.83; 95% CI, 1.64∼2.05), congestive heart failure (RR, 3.23; 95% CI, 2.54∼4.10), and all-cause death (RR, 2.09; 95% CI, 1.84∼ 2.38) [35]. In the Microalbuminuria: A Genoa Investigation on Complications (MAGIC) study, microalbuminuria in patients with HTN and without CKD (eGFR ≥60 mL/min/1.73 m2) was significantly related to chronic renal insufficiency (RR, 12.75; 95% CI, 3.62∼44.92) and cardiorenal events (RR, 2.58; 95% CI, 1.32∼5.05) [36].
In patients with CKD, the monitoring of ACR is important. If CKD and albuminuria appear simulta-neously, they can accelerate poor blood pressure and markedly reduce renal function [13, 14, 36]. In a collaborative meta-analysis of high-risk population cohorts, van der Velde et al. reported that if CKD and albuminuria appeared simultaneously, the HRs of all-cause (min, 1.96 times; max, 5.43 times) and cardiovascular mortality (min, 2.56 times; max, 7.21 times) are elevated [37]. In addition, Levey et al. suggested that if CKD and albuminuria appeared simultaneously, the ORs of all-cause mortality (min, 2.2 times; max, 6.6 times), cardiovascular mortality (min, 2.8 times; max, 8.1 times), ESRD (min, 40 times; max, 2,286 times), and acute kidney injury (min, 6.4 times; max, 29 times) are elevated [14]. They argued that these results may be due to the synergistic effects of albuminuria and CKD. In the present study, the synergistic effects of albuminuria and CKD markedly increased the OR of HTN. Therefore, clinicians should assess both ACR and eGFR to evaluate the cardio-vascular risks in the treatment of patients with HTN.
The limitation of the present study was that it is unclear whether HTN was responsible for the decreased renal function because our study was cross-sectional. Although the present study had limitations, this is the study to report on the synergistic effects of albuminuria and CKD for HTN in Korean men and women. Therefore, more accurate results might be obtained by performing a cohort study.
In conclusions, the present study investigated the association between hypertension and eGFR and ACR in Korean adults using data from the sixth KNHANES conducted in 2013∼2014. Hypertension was associated with decreased eGFR and elevated ACR in Korean men and women. The prevalence of hypertension increased greatly when decreased eGFR and elevated ACR occurred simultaneously. 요 약 본 연구는 한국 성인에서 고혈압(HTN), 추정사구체여과율 (eGFR) 및 소변미세알부민/크레아티닌 비율(ACR)과의 연관성을 평가하기 위한 연구이다. 제 6차 국민건강영양조사(2013~2014) 에서 20세 이상 8,922명(남자 3,941명, 여자 4,981명)을 대상으로 관련변수를 보정한 후, 신기능저하(eGFR <60 mL/min/1.73 m2) 및 알부민뇨(ACR ≥30 mg/g)에 따른 고혈압의 위험률을 분석하 였다. 남자의 경우 HTN [수축기 혈압(SBP) ≥140 mmHg, 이완기 혈 압(DBP) ≥90 mmHg 또는 HTN 약물 사용]의 위험비(ORs)가 정 상 그룹(eGFR ≥60 mL/min /1.73 m2 및 ACR <30 mg/g)에 비
하여 저하된 eGFR 그룹(eGFR <60 mL/min/1.73 m2, 1.98;
95% CI, 1.21∼3.24), ACR 상승 그룹(ACR ≥30 mg/g, 2.03; 95% CI, 1.54∼2.69), eGFR이 감소하고 ACR이 증가된 그룹 (eGFR <60 mL/min/1.73 m2 및 ACR ≥30 mg/g, 6.03; 95%
CI, 2.82∼12.92)에서 유의하게 높았다. 여자에서 HTN의 위험률 은 정상 그룹보다 eGFR 저하 그룹(2.29, 95% CI, 1.27∼4.13), ACR 상승 그룹(2.22, 95% CI, 1.68∼2.94)과 eGFR이 저하되고 ACR이 증가된 그룹(10.77, 95% CI, 3.89∼29.82)에서 유의하게 높았다.
결과적으로 HTN은 한국 성인에서 eGFR 저하, ACR 상승과 관 련이 있으며, eGFR 저하와 ACR 상승이 동시에 발생했을 때 HTN 의 유병률이 크게 증가했다.
Acknowledgements: This paper was supported by Wonkwang Health Science University in 2020.
Conflict of interest: None
Author’s information (Position): Lee JH, Professor.
REFERENCES
1. Muntner P, He J, Hamm L, Loria C, Whelton PK. Renal in-sufficiency and subsequent death resulting from cardiovascular disease in the United States. J Am Soc Nephrol. 2002;13:745-753. 2. Wen CP, Cheng TY, Tsai MK, Chang YC, Chan HT, Tsai SP, et al. All-cause mortality attributable to chronic kidney disease: a pro-spective cohort study based on 462 293 adults in Taiwan. Lance.t 2008;371:2173–2182. https://doi.org/10.1016/S0140-6736(08) 60952-6
3. Hallan SI, Coresh J, Astor BC, Asberg A, Powe NR, Romundstad S, et al. International comparison of the relationship of chronic kidney disease prevalence and ESRD risk. J Am Soc Nephrol. 2006;17:2275–2284. https://doi.org/10.1681/ASN.2005121273 4. Coresh J, Selvin E, Stevens LA, Manzi J, Kusek JW, Eggers P, et al.
Prevalence of chronic kidney disease in the United States. JAMA. 2007;298:2038–2047. https://doi.org/10.1001/jama.298.17.2038 5. National Kidney Foundation: K/DOQI clinical practice guide-lines for chronic kidney disease: evaluation, classification, and stratification. Am J Kidney Dis. 2002;39(2 Suppl 1):1-266. 6. Levey AS, Atkins R, Coresh J, Cohen EP, Collins AJ, Eckardt KU, et
al. Chronic kidney disease as a global public health problem: ap-proaches and initiatives - a position statement from Kidney Disease Improving Global Outcomes. Kidney Int. 2007;72:247– 259. https://doi.org/10.1038/sj.ki.5002343
7. Bakris GL, Ritz E. World Kidney Day Steering Committee: The message for World Kidney Day 2009: hypertension and kid-ney disease: a marriage that should be prevented. J Clin Hypertens (Greenwich). 2009;11:144–147. https://doi.org/10. 1097/HJH.0b013e328327706a
8. Coresh J, Wei GL, McQuillan G, Brancati FL, Levey AS, Jones C, et al. Prevalence of high blood pressure and elevated serum crea-tinine level in the United States: findings from the third National Health and Nutrition Examination Survey (1988-1994). Arch Intern Med. 2001;161:1207–1216. https://doi.org/10.1001/archinte. 161.9.1207
9. Agarwal R, Nissenson AR, Batlle D, Coyne DW, Trout JR, Warnock DG. Prevalence, treatment, and control of hypertension in chron-ic hemodialysis patients in the United States. Am J Med. 2003;115:291–297. https://doi.org/10.1016/s0002-9343(03)00366-8 10. Ahn HJ, Moon DS, Kang DY, Lee JI, Kim DY, Kim JH, et al. Urinary
albumin excretion reflects cardiovascular risk in postmenopausal women without diabetes: The 2011 to 2013 Korean National Health and Nutrition Examination Survey. Endocrinol Metab (Seoul). 2016;31:537–546. https://doi.org/10.3803/EnM.2016.31.4.537 11. American Diabetes Association. 9. Cardiovascular disease and
risk management. Diabetes Care. 2017;40(Suppl 1):75-87. https:// doi.org/10.2337/dc17-S012
12. Gee MY, Yoon H. The association of uine mcroalbumin and pulse
pressure in Korean adults. Korean J Clin Lab Sci. 2016;48:183– 187. https://doi.org/10.15324/kjcls.2016.48.3.183
13. Inker LA, Astor BC, Fox CH, Isakova T, Lash JP, Peralta CA, et al. KDOQI US commentary on the 2012 KDIGO clinical practice guideline for the evaluation and management of CKD. Am J Kidney Dis. 2014;63:713–735. https://doi.org/10.1053/j.ajkd.2014. 01.416
14. Levey AS, de Jong PE, Coresh J, El Nahas M, Astor BC, Matsushita K, et al. The definition, classification, and prognosis of chronic kidney disease: a KDIGO Controversies Conference report. Kidney Int. 2011;80:17–28. https://doi.org/10.1038/ki.2010.483 15. Levey AS, Stevens LA. Estimating GFR using the CKD
epidemiol-ogy collaboration (CKD-EPI) creatinine equation: more accurate GFR estimates, lower CKD prevalence estimates, and better risk predictions. Am J Kidney Dis. 2010;55:622–627. https://doi.org/ 10.1053/j.ajkd.2010.02.337
16. Zhang QL, Rothenbacher D. Prevalence of chronic kidney disease in population-based studies: systematic review. BMC Public Health. 2008;8:117. https://doi.org/10.1186/1471-2458-8-117 17. Chen J, Wildman RP, Gu D, Kusek JW, Spruill M, Reynolds K, et al.
Prevalence of decreased kidney function in Chinese adults aged 35 to 74 years. Kidney Int. 2005;68:2837–2845. https://doi.org/ 10.1111/j.1523-1755.2005.00757.x
18. Shankar A, Klein R, Klein BE. The association among smoking, heavy drinking, and chronic kidney disease. Am J Epidemiol. 2006;164:263–271. https://doi.org/10.1093/aje/kwj173
19. Kiuchi MG, Mion D Jr. Chronic kidney disease and risk factors re-sponsible for sudden cardiac death: a whiff of hope? Kidney Res Clin Pract. 2016;35:3–9. https://doi.org/10.1016/j.krcp.2015.11.003 20. Yoon H, Lee JH. Relationship between the estimated glomerular
filtration rate and the urine microalbumin/creatinine ratio and ferritin in Korean adults. Korean J Clin Lab Sci. 2019;51:145–154. https://doi.org/10.15324/kjcls.2019.51.2.145
21. Vejakama P, Ingsathit A, McKay GJ, Maxwell AP, McEvoy M, Attia J, et al. Treatment effects of renin-angiotensin aldosterone sys-tem blockade on kidney failure and mortality in chronic kidney disease patients. BMC Nephrol. 2017;18:342. https://doi.org/10. 1186/s12882-017-0753-9.
22. Lin YP. Albuminuria in hypertension. Hypertens Res. 2013;36: 762–764. https://doi.org/10.1038/hr.2013.76
23. Renna NF, de Las Heras N, Miatello RM. Pathophysiology of vas-cular remodeling in hypertension. Int J Hypertens. 2013;2013: 808353. https://doi.org/10.1155/2013/808353
24. Stehouwer CD, Smulders YM. Microalbuminuria and risk for cardiovascular disease: analysis of potential mechanisms. J Am Soc Nephrol. 2006;17:2106–2111. https://doi.org/10.1681/ASN. 2005121288
25. Ruiz-Hurtado G, Ruilope LM, de la Sierra A, Sarafidis P, de la Cruz JJ, Gorostidi M, et al. Association between high and very high albuminuria and nighttime blood pressure: influence of dia-betes and chronic kidney disease. Diadia-betes Care. 2016;39:1729– 1737. https://doi.org/10.2337/dc16-0748.
26. Wang K, Hu J, Luo T, Wang Y, Yang S, Qing H, et al. Effects of an-giotensin-converting enzyme inhibitors and angiotensin II re-ceptor blockers on all-cause mortality and renal outcomes in pa-tients with diabetes and albuminuria: a systematic review and meta-analysis. Kidney Blood Press Res. 2018;43:768–779. https://
doi.org/10.1159/000489913
27. Lee HF, See LC, Chan YH, Yeh YH, Wu LS, Liu JR, et al. End-stage renal disease patients using angiotensconverting enzyme in-hibitors and angiotensin receptor blockers may reduce the risk of mortality: a Taiwanese nationwide cohort study. Intern Med J. 2018;48:1123–1132. https://doi.org/10.1111/imj.13971
28. Agodoa LY, Appel L, Bakris GL, Beck G, Bourgoignie J, Briggs JP, et al. Effect of ramipril vs amlodipine on renal outcomes in hy-pertensive nephrosclerosis: a randomized controlled trial. JAMA. 2001;285:2719–2728. https://doi.org/10.1001/jama.285.21.2719 29. Zheng CM, Wang JY, Chen TT, Wu YC, Wu YL, Lin HT, et al.
Angiotensin-converting enzyme inhibitors or angiotensin re-ceptor blocker monotherapy retard deterioration of renal func-tion in Taiwanese chronic kidney disease populafunc-tion. Sci Rep. 2019;9:2694. https://doi.org/10.1038/s41598-019-38991-z 30. Said S, Hernandez GT. The link between chronic kidney disease
and cardiovascular disease. J Nephropathol. 2014;3:99–104. https://doi.org/10.12860/jnp.2014.19
31. Alonso A, Lopez FL, Matsushita K, Loehr LR, Agarwal SK, Chen LY, et al. Chronic kidney disease is associated with the incidence of atrial fibrillation: the atherosclerosis risk in communities (ARIC) study. Circulation. 2011;123:2946–2953. https://doi.org/ 10.1161/CIRCULATIONAHA.111.020982
32. Nayor M, Larson MG, Wang N, Santhanakrishnan R, Lee DS, Tsao CW, et al. The association of chronic kidney disease and micro-albuminuria with heart failure with preserved vs. reduced
ejec-tion fracejec-tion. Eur J Heart Fail. 2017;19:615–623. https://doi. org/10.1002/ejhf.778
33. Guh JY. Proteinuria versus albuminuria in chronic kidney disease. Nephrology (Carlton). 2010;15(Suppl 2):53-56. https:// doi.org/10.1111/j.1440-1797.2010.01314.x
34. Arnlöv J, Evans JC, Meigs JB, Wang TJ, Fox CS, Levy D, et al. Low-grade albuminuria and incidence of cardiovascular disease events in nonhypertensive and nondiabetic individuals: the Framingham Heart Study. Circulation. 2005;112:969–975. https:// doi.org/10.1161/CIRCULATIONAHA.105.538132
35. Gerstein HC, Mann JF, Yi Q, Zinman B, Dinneen SF, Hoogwerf B, et al. Albuminuria and risk of cardiovascular events, death, and heart failure in diabetic and nondiabetic individuals. JAMA. 2001;286:421–426. https://doi.org/10.1001/jama.286.4.421 36. Viazzi F, Leoncini G, Conti N, Tomolillo C, Giachero G, Vercelli
M, et al. Microalbuminuria is a predictor of chronic renal in-sufficiency in patients without diabetes and with hypertension: the MAGIC study. Clin J Am Soc Nephrol. 2010;5:1099–1106. https://doi.org/10.2215/CJN.07271009
37. van der Velde M, Matsushita K, Coresh J, Astor BC, Woodward M, Levey A, et al. Lower estimated glomerular filtration rate and higher albuminuria are associated with all-cause and car-diovascular mortality. A collaborative meta-analysis of high-risk population cohorts. Kidney Int. 2011;79:1341–1352. https://doi. org/10.1038/ki.2010.536