82 | Nature | Vol 578 | 6 February 2020
Pan-cancer analysis of whole genomes
The ICGC/TCGA Pan-Cancer Analysis of Whole Genomes Consortium
Cancer is driven by genetic change, and the advent of massively parallel sequencing has
enabled systematic documentation of this variation at the whole-genome scale
1–3. Here
we report the integrative analysis of 2,658 whole-cancer genomes and their matching
normal tissues across 38 tumour types from the Pan-Cancer Analysis of Whole Genomes
(PCAWG) Consortium of the International Cancer Genome Consortium (ICGC) and The
Cancer Genome Atlas (TCGA). We describe the generation of the PCAWG resource,
facilitated by international data sharing using compute clouds. On average, cancer
genomes contained 4–5 driver mutations when combining coding and non-coding
genomic elements; however, in around 5% of cases no drivers were identified,
suggesting that cancer driver discovery is not yet complete. Chromothripsis, in which
many clustered structural variants arise in a single catastrophic event, is frequently an
early event in tumour evolution; in acral melanoma, for example, these events precede
most somatic point mutations and affect several cancer-associated genes
simultaneously. Cancers with abnormal telomere maintenance often originate from
tissues with low replicative activity and show several mechanisms of preventing
telomere attrition to critical levels. Common and rare germline variants affect patterns
of somatic mutation, including point mutations, structural variants and somatic
retrotransposition. A collection of papers from the PCAWG Consortium describes
non-coding mutations that drive cancer beyond those in the TERT promoter
4; identifies
new signatures of mutational processes that cause base substitutions, small insertions
and deletions and structural variation
5,6; analyses timings and patterns of tumour
evolution
7; describes the diverse transcriptional consequences of somatic mutation on
splicing, expression levels, fusion genes and promoter activity
8,9; and evaluates a range
of more-specialized features of cancer genomes
8,10–18.
Cancer is the second most-frequent cause of death worldwide,
killing more than 8 million people every year; the incidence of cancer
is expected to increase by more than 50% over the coming decades
19,20.
‘Cancer’ is a catch-all term used to denote a set of diseases characterized
by autonomous expansion and spread of a somatic clone. To achieve
this behaviour, the cancer clone must co-opt multiple cellular pathways
that enable it to disregard the normal constraints on cell growth, modify
the local microenvironment to favour its own proliferation, invade
through tissue barriers, spread to other organs and evade immune
sur-veillance
21. No single cellular program directs these behaviours. Rather,
there is a large pool of potential pathogenic abnormalities from which
individual cancers draw their own combinations: the commonalities
of macroscopic features across tumours belie a vastly heterogeneous
landscape of cellular abnormalities.
This heterogeneity arises from the stochastic nature of Darwinian
evolution. There are three preconditions for Darwinian evolution:
characteristics must vary within a population; this variation must be
heritable from parent to offspring; and there must be competition for
survival within the population. In the context of somatic cells, heritable
variation arises from mutations acquired stochastically throughout
life, notwithstanding additional contributions from germline and
epigenetic variation. A subset of these mutations alter the cellular
phenotype, and a small subset of those variants confer an advantage
on clones during the competition to escape the tight physiological
controls wired into somatic cells. Mutations that provide a selective
advantage to the clone are termed driver mutations, as opposed to
selectively neutral passenger mutations.
Initial studies using massively parallel sequencing demonstrated the
feasibility of identifying every somatic point mutation, copy-number
change and structural variant (SV) in a given cancer
1–3. In 2008,
recog-nizing the opportunity that this advance in technology provided, the
global cancer genomics community established the ICGC with the
goal of systematically documenting the somatic mutations that drive
common tumour types
22.
The pan-cancer analysis of whole genomes
The expansion of whole-genome sequencing studies from individual
ICGC and TCGA working groups presented the opportunity to
under-take a meta-analysis of genomic features across tumour types. To
achieve this, the PCAWG Consortium was established. A Technical
Working Group implemented the informatics analyses by aggregating
the raw sequencing data from different working groups that studied
individual tumour types, aligning the sequences to the human genome
and delivering a set of high-quality somatic mutation calls for
down-stream analysis (Extended Data Fig. 1). Given the recent meta-analysis
https://doi.org/10.1038/s41586-020-1969-6
Received: 29 July 2018
Accepted: 11 December 2019
Published online: 5 February 2020
Open access
Nature | Vol 578 | 6 February 2020 | 83
of exome data from the TCGA Pan-Cancer Atlas
23–25, scientific working
groups concentrated their efforts on analyses best-informed by
whole-genome sequencing data.
We collected genome data from 2,834 donors (Extended Data
Table 1), of which 176 were excluded after quality assurance. A further
75 had minor issues that could affect some of the analyses (grey-listed
donors) and 2,583 had data of optimal quality (white-listed donors)
(Supplementary Table 1). Across the 2,658 white- and grey-listed donors,
whole-genome sequencing data were available from 2,605 primary
tumours and 173 metastases or local recurrences. Mean read coverage
was 39× for normal samples, whereas tumours had a bimodal
cover-age distribution with modes at 38× and 60× (Supplementary Fig. 1).
RNA-sequencing data were available for 1,222 donors. The final cohort
comprised 1,469 men (55%) and 1,189 women (45%), with a mean age of
56 years (range, 1–90 years) across 38 tumour types (Extended Data
Table 1 and Supplementary Table 1).
To identify somatic mutations, we analysed all 6,835 samples using
a uniform set of algorithms for alignment, variant calling and quality
control (Extended Data Fig. 1, Supplementary Fig. 2 and Supplementary
Methods 2). We used three established pipelines to call somatic
single-nucleotide variations (SNVs), small insertions and deletions (indels),
copy-number alterations (CNAs) and SVs. Somatic retrotransposition
events, mitochondrial DNA mutations and telomere lengths were also
called by bespoke algorithms. RNA-sequencing data were uniformly
processed to call transcriptomic alterations. Germline variants
identi-fied by the three separate pipelines included single-nucleotide
poly-morphisms, indels, SVs and mobile-element insertions (Supplementary
Table 2).
The requirement to uniformly realign and call variants on
approxi-mately 5,800 whole genomes presented considerable computational
challenges, and raised ethical issues owing to the use of data from
dif-ferent jurisdictions (Extended Data Table 2). We used cloud
comput-ing
26,27to distribute alignment and variant calling across 13 data centres
on 3 continents (Supplementary Table 3). Core pipelines were
pack-aged into Docker containers
28as reproducible, stand-alone packages,
which we have made available for download. Data repositories for raw
and derived datasets, together with portals for data visualization and
exploration, have also been created (Box 1 and Supplementary Table 4).
Benchmarking of genetic variant calls
To benchmark mutation calling, we ran the 3 core pipelines, together
with 10 additional pipelines, on 63 representative tumour–normal
genome pairs (Supplementary Note 1). For 50 of these cases, we
per-formed validation by hybridization of tumour and matched normal DNA
to a custom bait set with deep sequencing
29. The 3 core somatic
variant-calling pipelines had individual estimates of sensitivity of 80–90%
to detect a true somatic SNV called by any of the 13 pipelines; more
Box 1
Online resources for data access, visualization and analysis
The PCAWG landing page (http://docs.icgc.org/pcawg) provides
links to several data resources for interactive online browsing,
analysis and download of PCAWG data and results (Supplementary
Table 4).
Direct download of PCAWG data
Aligned PCAWG read data in BAM format are also available at
the European Genome Phenome Archive (EGA; https://www.
ebi.ac.uk/ega/search/site/pcawg under accession number
EGAS00001001692). In addition, all open-tier PCAWG genomics
data, as well as reference datasets used for analysis, can be
downloaded from the ICGC Data Portal at http://docs.icgc.org/
pcawg/data/. Controlled-tier genomic data, including SNVs and
indels that originated from TCGA projects (in VCF format) and
aligned reads (in BAM format) can be downloaded using the
Score (https://www.overture.bio/) software package, which has
accelerated and secure file transfer, as well as BAM slicing facilities
to selectively download defined regions of genomic alignments.
PCAWG computational pipelines
The core alignment, somatic variant-calling, quality-control and
variant consensus-generation pipelines used by PCAWG have each
been packaged into portable cross-platform images using the
Dockstore system
84and released under an Open Source licence that
enables unrestricted use and redistribution. All PCAWG Dockstore
images are available to the public at https://dockstore.org/
organizations/PCAWG/collections/PCAWG.
ICGC Data Portal
The ICGC Data Portal
85(https://dcc.icgc.org) serves as the main
entry point for accessing PCAWG datasets with a single uniform web
interface and a high-performance data-download client. This uniform
interface provides users with easy access to the myriad of PCAWG
sequencing data and variant calls that reside in many repositories
and compute clouds worldwide. Streaming technology
86provides
users with high-level visualizations in real time of BAM and VCF files
stored remotely on the Cancer Genome Collaboratory.
UCSC Xena
UCSC Xena
87(https://pcawg.xenahubs.net) visualizes all PCAWG
primary results, including copy-number, gene-expression, gene-fusion
and promoter-usage alterations, simple somatic mutations, large
somatic structural variations, mutational signatures and phenotypic
data. These open-access data are available through a public Xena
hub, and consensus simple somatic mutations can be loaded to the
local computer of a user via a private Xena hub. Kaplan–Meier plots,
histograms, box plots, scatter plots and transcript-specific views offer
additional visualization options and statistical analyses.
The Expression Atlas
The Expression Atlas (https://www.ebi.ac.uk/gxa/home) contains
RNA-sequencing and expression microarray data for querying
gene expression across tissues, cell types, developmental stages
and/or experimental conditions
88. Two different views of the data
are provided: summarized expression levels for each tumour type
and gene expression at the level of individual samples, including
reference-gene expression datasets for matching normal tissues.
PCAWG Scout
PCAWG Scout (http://pcawgscout.bsc.es/) provides a framework for
-omics workflow and website templating to generate on-demand,
in-depth analyses of the PCAWG data that are openly available to the
whole research community. Views of protected data are available
that still safeguard sensitive data. Through the PCAWG Scout web
interface, users can access an array of reports and visualizations
that leverage on-demand bioinformatic computing infrastructure
to produce results in real time, allowing users to discover trends as
well as form and test hypotheses.
Chromothripsis Explorer
Chromothripsis Explorer (http://compbio.med.harvard.edu/
chromothripsis/) is a portal that allows structural variation in the
PCAWG dataset to be explored on an individual patient basis
through the use of circos plots. Patterns of chromothripsis can also
be explored in aggregated formats.
84 | Nature | Vol 578 | 6 February 2020
than 95% of SNV calls made by each of the core pipelines were
genu-ine somatic variants (Fig. 1a). For indels—a more-challenging class of
variants to identify with short-read sequencing—the 3 core algorithms
had individual sensitivity estimates in the range of 40–50%, with
pre-cision of 70–95% (Fig. 1b). For individual SV algorithms, we estimated
precision to be in the range 80–95% for samples in the 63-sample pilot
dataset.
Next, we defined a strategy to merge results from the three pipelines
into one final call-set to be used for downstream scientific analyses
(Methods and Supplementary Note 2). Sensitivity and precision of
consensus somatic variant calls were 95% (90% confidence interval,
88–98%) and 95% (90% confidence interval, 71–99%), respectively, for
SNVs (Extended Data Fig. 2). For somatic indels, sensitivity and
preci-sion were 60% (34–72%) and 91% (73–96%), respectively (Extended Data
Fig. 2). Regarding somatic SVs, we estimate the sensitivity of merged
calls to be 90% for true calls generated by any one pipeline; precision
was estimated as 97.5%. The improvement in calling accuracy from
combining different pipelines was most noticeable in variants with
low variant allele fractions, which probably originate from tumour
subclones (Fig. 1c, d). Germline variant calls, phased using a
haplotype-reference panel, displayed a precision of more than 99% and a sensitivity
of 92–98% (Supplementary Note 2).
Analysis of PCAWG data
The uniformly generated, high-quality set of variant calls across more
than 2,500 donors provided the springboard for a series of scientific
working groups to explore the biology of cancer. A comprehensive
suite of companion papers that describe the analyses and discoveries
across these thematic areas is copublished with this paper
4–18(Extended
Data Table 3).
Pan-cancer burden of somatic mutations
Across the 2,583 white-listed PCAWG donors, we called 43,778,859
somatic SNVs, 410,123 somatic multinucleotide variants, 2,418,247
somatic indels, 288,416 somatic SVs, 19,166 somatic retrotransposition
events and 8,185 de novo mitochondrial DNA mutations
(Supplemen-tary Table 1). There was considerable heterogeneity in the burden of
somatic mutations across patients and tumour types, with a broad
correlation in mutation burden among different classes of somatic
variation (Extended Data Fig. 3). Analysed at a per-patient level, this
correlation held, even when considering tumours with similar purity
and ploidy (Supplementary Fig. 3). Why such correlation should apply
on a pan-cancer basis is unclear. It is likely that age has some role, as we
observe a correlation between most classes of somatic mutation and
age at diagnosis (around 190 SNVs per year, P = 0.02; about 22 indels
per year, P = 5 × 10
−5; 1.5 SVs per year, P < 2 × 10
−16; linear regression
with likelihood ratio tests; Supplementary Fig. 4). Other factors are
also likely to contribute to the correlations among classes of somatic
mutation, as there is evidence that some DNA-repair defects can cause
multiple types of somatic mutation
30, and a single carcinogen can cause
a range of DNA lesions
31.
Panorama of driver mutations in cancer
We extracted the subset of somatic mutations in PCAWG tumours
that have high confidence to be driver events on the basis of current
knowledge. One challenge to pinpointing the specific driver
muta-tions in an individual tumour is that not all point mutamuta-tions in
recur-rently mutated cancer-associated genes are drivers
32. For genomic
elements significantly mutated in PCAWG data, we developed a
‘rank-and-cut’ approach to identify the probable drivers (Supplementary
Methods 8.1). This approach works by ranking the observed mutations
in a given genomic element based on recurrence, estimated functional
consequence and expected pattern of drivers in that element. We then
estimate the excess burden of somatic mutations in that genomic
element above that expected for the background mutation rate, and cut
the ranked mutations at this level. Mutations in each element with the
highest driver ranking were then assigned as probable drivers; those
below the threshold will probably have arisen through chance and were
assigned as probable passengers. Improvements to features that are
used to rank the mutations and the methods used to measure them
will contribute to further development of the rank-and-cut approach.
We also needed to account for the fact that some bona fide cancer
genomic elements were not rediscovered in PCAWG data because
of low statistical power. We therefore added previously known
cancer-associated genes to the discovery set, creating a ‘compendium
of mutational driver elements’ (Supplementary Methods 8.2). Then,
using stringent rules to nominate driver point mutations that affect
these genomic elements on the basis of prior knowledge
33, we separated
probable driver from passenger point mutations. To cover all classes
of variant, we also created a compendium of known driver SVs, using
analogous rules to identify which somatic CNAs and SVs are most likely
to act as drivers in each tumour. For probable pathogenic germline
variants, we identified all truncating germline point mutations and
SVs that affect high-penetrance germline cancer-associated genes.
This analysis defined a set of mutations that we could confidently
assert, based on current knowledge, drove tumorigenesis in the more
than 2,500 tumours of PCAWG. We found that 91% of tumours had at
least one identified driver mutation, with an average of 4.6 drivers per
tumour identified, showing extensive variation across cancer types
(Fig. 2a). For coding point mutations, the average was 2.6 drivers per
tumour, similar to numbers estimated in known cancer-associated
genes in tumours in the TCGA using analogous approaches
32.
To address the frequency of non-coding driver point mutations,
we combined promoters and enhancers that are known targets of
Adiscan BETA MuTectDKFZ
LOH complete MuSE 0.9 Tier0 OICR-bl SGA Sanger
WUSTL c TTT H m e M 0. W Mu F1 = 0.1= 0.1 F1 = 0.2= 0 F1 = 0.3= 0 F1 = 0.4= 0 F1 = 0.5= 0 F1 = 0.6= 0 F1 = 0.7= 0 F1 = 0.8= 0 0 0.25 0.50 0.75 1.00 0 0.25 0.50 0.75 1.00 Sensitivity Precision MuTect2 CRG Clindel DKFZ novobreak indel SGA Sanger SMuFin WUSTL o r de U CRG M L GA M DK t2 ng F1 = 0.1= 0.1 F1 = 0.2= 0 F1 = 0.3= 0 F1 = 0.4= F1 = 0.5= F1 = 0.6= F1 = 0.7= F1 = 0.8= 0 0.25 0.50 0.75 1.00 0 0.25 0.50 0.75 1.00 Sensitivity Precision
a
d
c
b
F 1 Precision Sensitivity [0,0.1 ] (0.1,0.2] (0.2,0.3 ] (0.3,0.5 ] (0.5,1 ] 0.6 0.8 1.0 0.6 0.8 1.0 0.6 0.8 1.0 VAF Accuracy F 1 Precision Sensitivity [0,0.1] (0.1,0.2] (0.2,0.3 ] (0.3,0.5] (0.5,1 ] 0 0.50 1.00 0 0.50 1.00 0 0.50 1.00 VAF Accuracy DKFZMuTect SangerLogistic regressiontwo_plus DKFZSanger SMuFinLogistic regressiontwo_plus
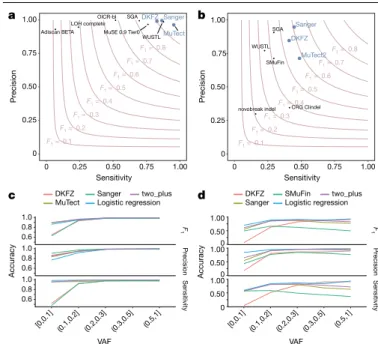
Fig. 1 | Validation of variant-calling pipelines in PCAWG. a, Scatter plot of
estimated sensitivity and precision for somatic SNVs across individual algorithms assessed in the validation exercise across n = 63 PCAWG samples. Core algorithms included in the final PCAWG call set are shown in blue.
b, Sensitivity and precision estimates across individual algorithms for
somatic indels. c, Accuracy (precision, sensitivity and F1 score, defined as
2 × sensitivity × precision/(sensitivity + precision)) of somatic SNV calls across variant allele fractions (VAFs) for the core algorithms. The accuracy of two methods of combining variant calls (two-plus, which was used in the final dataset, and logistic regression) is also shown. d, Accuracy of indel calls across variant allele fractions.
Nature | Vol 578 | 6 February 2020 | 85
non-coding drivers
34–37with those newly discovered in PCAWG data;
this is reported in a companion paper
4. Using this approach, only
13% (785 out of 5,913) of driver point mutations were non-coding
in PCAWG. Nonetheless, 25% of PCAWG tumours bear at least one
putative non-coding driver point mutation, and one third (237 out
of 785) affected the TERT promoter (9% of PCAWG tumours). Overall,
non-coding driver point mutations are less frequent than coding
driver mutations. With the exception of the TERT promoter,
indi-vidual enhancers and promoters are only infrequent targets of driver
mutations
4.
Across tumour types, SVs and point mutations have different
rela-tive contributions to tumorigenesis. Driver SVs are more prevalent
in breast adenocarcinomas (6.4 ± 3.7 SVs (mean ± s.d.) compared
with 2.2 ± 1.3 point mutations; P < 1 × 10
−16, Mann–Whitney U-test)
and ovary adenocarcinomas (5.8 ± 2.6 SVs compared with 1.9 ± 1.0
point mutations; P < 1 × 10
−16), whereas driver point mutations have
a larger contribution in colorectal adenocarcinomas (2.4 ± 1.4 SVs
compared with 7.4 ± 7.0 point mutations; P = 4 × 10
−10) and mature
B cell lymphomas (2.2 ± 1.3 SVs compared with 6 ± 3.8 point
muta-tions; P < 1 × 10
−16), as previously shown
38. Across tumour types, there
are differences in which classes of mutation affect a given genomic
element (Fig. 2b).
We confirmed that many driver mutations that affect
tumour-suppressor genes are two-hit inactivation events (Fig. 2c). For
exam-ple, of the 954 tumours in the cohort with driver mutations in TP53,
736 (77%) had both alleles mutated, 96% of which (707 out of 736)
combined a somatic point mutation that affected one allele with
somatic deletion of the other allele. Overall, 17% of patients had
rare germline protein-truncating variants (PTVs) in
cancer-predis-position genes
39, DNA-damage response genes
40and somatic driver
genes. Biallelic inactivation due to somatic alteration on top of a
germline PTV was observed in 4.5% of patients overall, with 81% of
Liver–HCC Panc–AdenoCA Prost–AdenoCA Breast–AdenoCa Kidney–RCC CNS–Medullo Ovary–AdenoCA Skin–Melanom
a
Lymph–BNHL Eso–AdenoC
a
Lymph–CLL CNS–PiloAstr
o
Panc–Endocrine Stomach–AdenoCA Head–SCC ColoRect–AdenoCA Thy–AdenoCA Lung–SCC Uterus–AdenoC
A Kidney–ChRC C CNS–GBM Lung–AdenoCA Bone–Osteosar c SoftT issue–Leiomyo Biliary–AdenoCA Bladder–TCC
Germline susceptibility variants Somatic non-coding drivers Somatic coding drivers SGR drivers SCNA drivers WG duplications
Coding Promoter Intron splicing 3′ UTR5′ UTR Amplified oncogene Deleted TSG Truncated TSG Fusion gene
cis-activating GR Mutations SCNA and SV 71 74 76 83 84 85 88 89 90 90 95 103 106 107 118 162 167 177 181 258 263 269 287 316 475 954 0 0.25 0.50 0.75 1.00 ATM CREBBPMAP2K4 CCND1MCL1 PBRM1APC KMT2D 19p13.3aVHL CCNE1NF1 MYCERG CTNNB1BRAF RB1 PIK3CA SMAD4 CDKN2BTERT PTEN KRAS ARID1A CDKN2ATP53 Number of patients Proportion of patients 0 0.1 0.3 0.5 0.80 1.00 0.63 0.82 0.77
Proportion of patients with the gene altered as biallelic
Number of patients Deletion/deletion Deletion/GR(break) Deletion/mutation Deletion/deletion Mutation/deletion Mutation/mutation Somatic/somatic Germline/somatic TP53 0 200 400 600 CDKN2 A CDKN2 B PTEN SMAD4 0 200 400 VHL RB1 PBRM 1 ARID1A MAP2K4 NF 1 AP C BRCA2 MEN1 ATM AXIN 1 BRCA1 MSR 1 DCC SETD2 BAP 1 TGFBR2 FAS EME2 STK11 KDM6 A CDH1 B2M DDX3 X FAT1 DAXX CREBBP NCOR 1 SMARCA4 IRF2 KDM5 C RNF43 ATRX TSC1 TNFRSF14 BRD 7 POLR2L PTCH1 FBXW7 PIK3R1 NF 2 CI C MAP3K1 0 20 40 60 80 0.91 0.46 0.76 0.17 0.70 0.47 0.48 0.75 0.86 0.42 0.83 0.77 1.00 0.76 0.43 0.69 0.57 0.92 1.00 0.75 0.53 0.66 0.36 0.57 0.38 1.00 0.22 0.57 0.33 0.38 0.52 0.58 0.47 0.67 0.71 0.86 1.00 0.52 0.25 0.33 0.73 0.71 0.28 20 60 100 Patients with drivers (%) All
Coding point muts Non-coding point muts Rearrangements SCNA Germline 91 76 25 26 73 17 0 2.5 5.0 7.5 Number of drivers 4.6 2.6 1.2 1.3 3.4 1.1 1.0 0 10
a
b
c
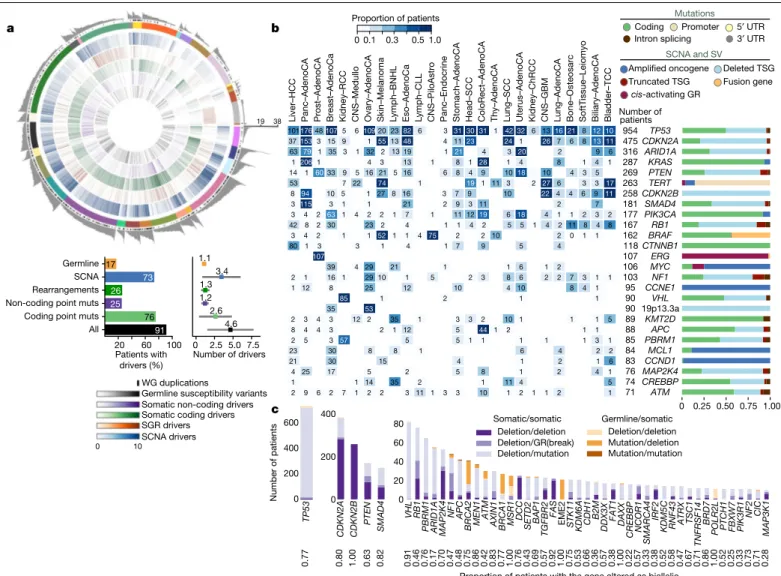
101176481075 6109202382 6 3 313031 1 4232 6 1316 21 8 1210 371533 15 9 1 551348 4 1123 24 1 26 7 6 8 1311 63 79 1 35 3 1 32 2 13 19 1 21 4 3 20 2 9 6 12061 4 3 13 1 8 1 28 1 4 8 1 4 1 14 1 6033 9 5 1621 5 16 6 8 4 9 1018 10 4 3 5 53 7 22 74 1 19 1 11 3 2 27 6 3 3 17 8 94 10 5 1 27 8 16 3 7 9 10 22 4 4 6 9 11 3115 3 1 1 21 2 9 3 11 2 7 3 4 2 63 1 4 2 2 1 7 1 11 1219 6 18 4 1 1 2 3 2 42 8 2 30 23 2 4 1 1 4 2 5 5 1 4 2 11 8 4 8 3 4 2 1 1 52 1 1 4 75 2 2 10 2 0 1 1 80 1 3 3 1 4 1 7 9 5 4 107 6 1 39 4 29 21 1 1 2 2 1 16 1 2910 1 5 2 3 8 6 2 2 7 3 1 1 1 12 8 25 12 10 4 10 8 4 1 1 1 85 2 1 35 53 2 3 4 3 12 2 35 1 3 3 2 10 1 1 1 5 8 4 4 3 2 1 12 5 44 1 2 1 1 2 5 3 57 5 5 1 1 1 1 1 3 1 23 30 8 8 1 6 4 2 2 21 30 15 4 1 2 1 6 4 25 17 5 2 5 8 1 2 4 1 1 1 14 35 2 1 11 4 5 2 9 6 2 7 1 2 2 3 11 1 3 3 10 1 2 1 1 2 1 19 38Fig. 2 | Panorama of driver mutations in PCAWG. a, Top, putative driver
mutations in PCAWG, represented as a circos plot. Each sector represents a tumour in the cohort. From the periphery to the centre of the plot the concentric rings represent: (1) the total number of driver alterations; (2) the presence of whole-genome (WG) duplication; (3) the tumour type; (4) the number of driver CNAs; (5) the number of driver genomic rearrangements; (6) driver coding point mutations; (7) driver non-coding point mutations; and (8) pathogenic germline variants. Bottom, snapshots of the panorama of driver mutations. The horizontal bar plot (left) represents the proportion of patients with different types of drivers. The dot plot (right) represents the mean number of each type of driver mutation across tumours with at least one event (the square dot) and the standard deviation (grey whiskers), based on n = 2,583
patients. b, Genomic elements targeted by different types of mutations in the cohort altered in more than 65 tumours. Both germline and somatic variants are included. Left, the heat map shows the recurrence of alterations across cancer types. The colour indicates the proportion of mutated tumours and the number indicates the absolute count of mutated tumours. Right, the proportion of each type of alteration that affects each genomic element.
c, Tumour-suppressor genes with biallelic inactivation in 10 or more patients.
The values included under the gene labels represent the proportions of patients who have biallelic mutations in the gene out of all patients with a somatic mutation in that gene. GR, genomic rearrangement; SCNA, somatic copy-number alteration; SGR, somatic genome rearrangement; TSG, tumour suppressor gene; UTR, untranslated region.
86 | Nature | Vol 578 | 6 February 2020
these affecting known cancer-predisposition genes (such as BRCA1,
BRCA2 and ATM).
PCAWG tumours with no apparent drivers
Although more than 90% of PCAWG cases had identified drivers, we
found none in 181 tumours (Extended Data Fig. 4a). Reasons for
miss-ing drivers have not yet been systematically evaluated in a pan-cancer
cohort, and could arise from either technical or biological causes.
Technical explanations could include poor-quality samples,
inad-equate sequencing or failures in the bioinformatic algorithms used.
We assessed the quality of the samples and found that 4 of the 181
cases with no known drivers had more than 5% tumour DNA
contami-nation in their matched normal sample (Fig. 3a). Using an algorithm
designed to correct for this contamination
41, we identified previously
missed mutations in genes relevant to the respective cancer types.
Similarly, if the fraction of tumour cells in the cancer sample is low
through stromal contamination, the detection of driver mutations
can be impaired. Most tumours with no known drivers had an
aver-age power to detect mutations close to 100%; however, a few had
power in the 70–90% range (Fig. 3b and Extended Data Fig. 4b). Even
in adequately sequenced genomes, lack of read depth at specific
driver loci can impair mutation detection. For example, only around
50% of PCAWG tumours had sufficient coverage to call a mutation
(≥90% power) at the two TERT promoter hotspots, probably because
the high GC content of this region causes biased coverage (Fig. 3c).
In fact, 6 hepatocellular carcinomas and 2 biliary cholangiocarcinomas
among the 181 cases with no known drivers actually did contain TERT
mutations, which were discovered after deep targeted sequencing
42.
Finally, technical reasons for missing driver mutations include
fail-ures in the bioinformatic algorithms. This affected 35
myeloprolif-erative neoplasms in PCAWG, in which the JAK2
V617Fdriver mutation
should have been called. Our somatic variant-calling algorithms rely
on ‘panels of normals’, typically from blood samples, to remove
recur-rent sequencing artefacts. As 2–5% of healthy individuals carry occult
haematopoietic clones
43, recurrent driver mutations in these clones
can enter panels of normals.
With regard to biological causes, tumours may be driven by
muta-tions in cancer-associated genes that are not yet described for that
tumour type. Using driver discovery algorithms on tumours with no
known drivers, no individual genes reached significance for point
muta-tions. However, we identified a recurrent CNA that spanned SETD2 in
a
b
0 5 10 15 Tumour-in-normal estimate (% ) 0 1 Averag e detectio ns ensitivityc
Chromosome 5: 1,259,228 Detectio ns ensitivity 0 1 0 1Chromosome 5: 1,259,250d
0.25 10–210–410–7 10–20 1 2 3 4 5 6 7 8 9 10 11 12 13 14 15 16 17 18 1920 21 22 2q37.3 3p21.31 5q35.2 8p23.1 10q26.13 16q24.317p13.3 FANCA (40 genes)TP53 (289 genes) SETD2 (13 genes) PCM1 (187 genes) (287 genes) FGFR2 (151 genes) (80 genes) Chromosom e q value 1 2 3 4 5 6 7 8 9 10 11 12 13 14 15 16 17 1819202122 Kidney–ChRC C Panc–Endocrin e
e
Chromosome loss Chromosome gain
Biliary–AdenoC A Bone–Car t Bone–Epith Bone–Osteosarc Breast–AdenoCA CNS–Medullo Eso–AdenoC A Head–SCC Kidney–ChRCC Kidney–RCC Liver–HC C Lung–AdenoC a Lymph–BNHL Lymph–CL L Myel oid–AM L Myel oid–MD S Myel oid–MP N Panc–AdenoC A Panc–Endocrin e Prost–AdenoC A Skin–Melanom a Stomach–AdenoC A Thy–AdenoC A B iliary–AdenoC A CNS–Medull o Head–SCC Liver–HC C Skin–Melanom a Thy–AdenoC A
Fig. 3 | Analysis of patients with no detected driver mutations. a, Individual
estimates of the percentage of tumour-in-normal contamination across patients with no driver mutations in PCAWG (n = 181). No data were available for myelodysplastic syndromes and acute myeloid leukaemia. Points represent estimates for individual patients, and the coloured areas are estimated density distributions (violin plots). Abbreviations of the tumour types are defined in Extended Data Table 1. b, Average detection sensitivity by tumour type for tumours without known drivers (n = 181). Each dot represents a given sample and is the average sensitivity of detecting clonal substitutions across the genome, taking into account purity and ploidy. Coloured areas are estimated density distributions, shown for cohorts with at least five cases. c, Detection
sensitivity for TERT promoter hotspots in tumour types in which TERT is frequently mutated. Coloured areas are estimated density distributions.
d, Significant copy-number losses identified by two-sided hypothesis testing
using GISTIC2.0, corrected for multiple-hypothesis testing. Numbers in parentheses indicate the number of genes in significant regions when analysing medulloblastomas without known drivers (n = 42). Significant regions with known cancer-associated genes are labelled with the
representative cancer-associated gene. e, Aneuploidy in chromophobe renal cell carcinomas and pancreatic neuroendocrine tumours without known drivers. Patients are ordered on the y axis by tumour type and then by presence of whole-genome duplication (bottom) or not (top).
Nature | Vol 578 | 6 February 2020 | 87
medulloblastomas that lacked known drivers (Fig. 3d), indicating that
restricting hypothesis testing to missing-driver cases can improve
power if undiscovered genes are enriched in such tumours. Inactivation
of SETD2 in medulloblastoma significantly decreased gene
expres-sion (P = 0.002) (Extended Data Fig. 4c). Notably, SETD2 mutations
occurred exclusively in medulloblastoma group-4 tumours (P < 1 × 10
−4).
Group-4 medulloblastomas are known for frequent mutations in other
chromatin-modifying genes
44, and our results suggest that SETD2 loss
of function is an additional driver that affects chromatin regulators in
this subgroup.
Two tumour types had a surprisingly high fraction of patients
with-out identified driver mutations: chromophobe renal cell carcinoma
(44%; 19 out of 43) and pancreatic neuroendocrine cancers (22%;
18 out of 81) (Extended Data Fig. 4a). A notable feature of the
miss-ing-driver cases in both tumour types was a remarkably consistent
profile of chromosomal aneuploidy—patterns that have previously
been reported
45,46(Fig. 3e). The absence of other identified driver
muta-tions in these patients raises the possibility that certain combinamuta-tions
of whole-chromosome gains and losses may be sufficient to initiate
a cancer in the absence of more-targeted driver events such as point
mutations or fusion genes of focal CNAs.
Even after accounting for technical issues and novel drivers, 5.3% of
PCAWG tumours still had no identifiable driver events. In a research
setting, in which we are interested in drawing conclusions about
popu-lations of patients, the consequences of technical issues that affect
occasional samples will be mitigated by sample size. In a clinical setting,
in which we are interested in the driver mutations in a specific patient,
these issues become substantially more important. Careful and critical
appraisal of the whole pipeline—including sample acquisition, genome
sequencing, mapping, variant calling and driver annotation, as done
Fraction Fraction Events Chromople xy Chromothripsis Fraction No. fo ci Kataegis
a
b
d
Punctuated events across PCAWG
c
10 102 104 106 Chromoplexy interfootprint distance W BSCR1 7 TMPRSS 2 RUNX1T 1 RCBTB2 IGF2BP 3 MIR392 5 ZBTB44 CASC 11 THADA KDM4 C TRA2 A RUNX 1 LPAR 6 SRSF3SOX4 BR AF RPA1 BCL2 ST14 M YC MX 1 ER G RB1 IGH PA LM 2 BZRAP1 HIST 1H2BC HIST1H 2AC KIAA02 26L LINC01136 MIR155H G MIR4436A OSBPL10 ST6GAL1 TM SB 4X ZFP36L1 BCL2L1 1 TBC1D4 MI R4322 EIF2AK3 ZCCHC 7 IM M P2 L SMIM20 DN MT1 ZNF860 ZNF595 SEL1L3 FOXO1 MIR142 NEAT 1 AKAP2 RFTN1 BA CH 2 TCL1A SOCS1 DUSP 2 CXCR 4 BCL7A LR RN 3 AICD A S1 PR2 RHOH BIRC3 VMP1 LRMP AC TB DTX1 BTG1 BTG 2 XBP1 CIITA SGK1 PAX 5 ETS1 CD7 4 BCL2 AFF3 BCL6 CD 83 DM D RMI2 PIM1 FHIT PIM2 MY C IRF8 IRF1 IRF4 LTB LPP IGH IGK IG L 100 102 104 106 Kataegis interfocal distance 0 0.5 1.0 0 0.5 1.0 Small Amplified Far from telomere Classic single Multiple chrom. 0 0.5 1.0 1 10 100APOBEC3 + SV – SV Alt. C deamin.C[T>N]T UncertainPol η
Chromoplexy Balanced translocations 25 0 25 50 75 Interbreakpoint distance (bp) 10100 1 102 103 104 105 106 22 20 18 17 16 15 14 13 12 11 10 9 8 7 6 5 4 3 2 1 X Amplification Homozygous deletion No. losses No. gains Rearrangement 00 22
SOX2 (12)TERT (22) EGFR (9)
CCND1 (30) MDM2 (36) CDK4 (30) ERBB2 (30) NF1 (11) RB1 (7) CDKN2A (15) Liposarcoma-like Bladder−TCCLung−SC C Skin−Melanoma−Ac ral SoftTissue−Liposarc Lymph−BNHL Bone−Osteosarc Cervix−SC C Head−SCC Panc−AdenoCA SoftTissue−Leiom yo Skin−Melanoma−Cut Eso−AdenoCALung−AdenoC A Breast−AdenoC A Ovar y−AdenoC A CNS−GBM Breast−Lob ularCA Bilia ry−AdenoC A Stomach−AdenoCAColoRect−AdenoCA Liver−HCCLymph−CL L Bone−Epith Prost−AdenoCAUteru s−AdenoCA Kidne y−RCC−Clea r CNS−Oligo Panc−Endoc rine Kidne y−ChRC C Kidne y−RCC−P ap Thy−AdenoCABone−Benig n CNS−MedulloCNS−PiloAstroMy eloid−AML Myeloid−MP N RTN4RL1
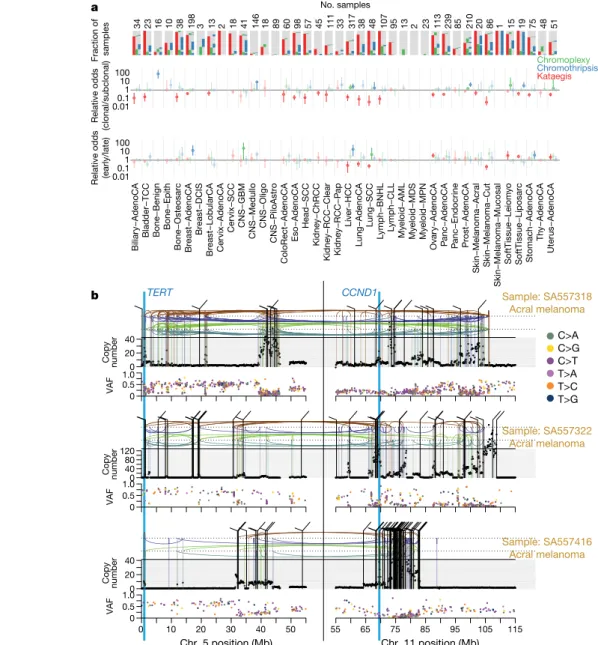
Fig. 4 | Patterns of clustered mutational processes in PCAWG. a, Kataegis.
Top, prevalence of different types of kataegis and their association with SVs (≤1 kb from the focus). Bottom, the distribution of the number of foci of kataegis per sample. Chromoplexy. Prevalence of chromoplexy across cancer types, subdivided into balanced translocations and more complex events. Chromothripsis. Top, frequency of chromothripsis across cancer types. Bottom, for each cancer type a column is shown, in which each row is a chromothripsis region represented by five coloured rectangles relating to its categorization. b, Circos rainfall plot showing the distances between consecutive kataegis events across PCAWG compared with their genomic position. Lymphoid tumours (khaki, B cell non-Hodgkin’s lymphoma; orange, chronic lymphocytic leukaemia) have hypermutation hot spots (≥3 foci with distance ≤1 kb; pale red zone), many of which are near known cancer-associated genes (red annotations) and have associated SVs (≤10 kb from the focus; shown as arcs in the centre). c, Circos rainfall plot as in b that shows the distance versus
the position of consecutive chromoplexy and reciprocal translocation footprints across PCAWG. Lymphoid, prostate and thyroid cancers exhibit recurrent events (≥2 footprints with distance ≤10 kb; pale red zone) that are likely to be driver SVs and are annotated with nearby genes and associated SVs, which are shown as bold and thin arcs for chromoplexy and reciprocal translocations, respectively (colours as in a). d, Effect of chromothripsis along the genome and involvement of PCAWG driver genes. Top, number of chromothripsis-induced gains or losses (grey) and amplifications (blue) or deletions (red). Within the identified chromothripsis regions, selected recurrently rearranged (light grey), amplified (blue) and homozygously deleted (magenta) driver genes are indicated. Bottom, interbreakpoint distance between all subsequent breakpoints within chromothripsis regions across cancer types, coloured by cancer type. Regions with an average interbreakpoint distance <10 kb are highlighted. C[T>N]T, kataegis with a pattern of thymine mutations in a Cp TpT context.
88 | Nature | Vol 578 | 6 February 2020
here—should be required for laboratories that offer clinical
sequenc-ing of cancer genomes.
Patterns of clustered mutations and SVs
Some somatic mutational processes generate multiple mutations in a
single catastrophic event, typically clustered in genomic space, leading
to substantial reconfiguration of the genome. Three such processes
have previously been described: (1) chromoplexy, in which repair of
co-occurring double-stranded DNA breaks—typically on different
chro-mosomes—results in shuffled chains of rearrangements
47,48(Extended
Data Fig. 5a); (2) kataegis, a focal hypermutation process that leads to
locally clustered nucleotide substitutions, biased towards a single DNA
strand
49–51(Extended Data Fig. 5b); and (3) chromothripsis, in which
tens to hundreds of DNA breaks occur simultaneously, clustered on
one or a few chromosomes, with near-random stitching together of
the resulting fragments
52–55(Extended Data Fig. 5c). We characterized
the PCAWG genomes for these three processes (Fig. 4).
Chromoplexy events and reciprocal translocations were identified
in 467 (17.8%) samples (Fig. 4a, c). Chromoplexy was prominent in
prostate adenocarcinoma and lymphoid malignancies, as previously
described
47,48, and—unexpectedly—thyroid adenocarcinoma.
Differ-ent genomic loci were recurrDiffer-ently rearranged by chromoplexy across
the three tumour types, mediated by positive selection for
particu-lar fusion genes or enhancer-hijacking events. Of 13 fusion genes or
enhancer hijacking events in 48 thyroid adenocarcinomas, at least
4 (31%) were caused by chromoplexy, with a further 4 (31%) part of
com-plexes that contained chromoplexy footprints (Extended Data Fig. 5a).
These events generated fusion genes that involved RET (two cases) and
NTRK3 (one case)
56, and the juxtaposition of the oncogene IGF2BP3
with regulatory elements from highly expressed genes (five cases).
Kataegis events were found in 60.5% of all cancers, with particularly
high abundance in lung squamous cell carcinoma, bladder cancer,
acral melanoma and sarcomas (Fig. 4a, b). Typically, kataegis
com-prises C > N mutations in a TpC context, which are probably caused
by APOBEC activity
49–51, although a T > N conversion in a TpT or CpT
process (the affected T is highlighted in bold) attributed to error-prone
polymerases has recently been described
57. The APOBEC signature
accounted for 81.7% of kataegis events and correlated positively with
APOBEC3B expression levels, somatic SV burden and age at diagnosis
(Supplementary Fig. 5). Furthermore, 5.7% of kataegis events involved
the T > N error-prone polymerase signature and 2.3% of events, most
notably in sarcomas, showed cytidine deamination in an alternative
GpC or CpC context.
Kataegis events were frequently associated with somatic SV
break-points (Fig. 4a and Supplementary Fig. 6a), as previously described
50,51.
Deletions and complex rearrangements were most-strongly
associ-ated with kataegis, whereas tandem duplications and other simple
SV classes were only infrequently associated (Supplementary Fig. 6b).
Kataegis inducing predominantly T > N mutations in CpTpT context
was enriched near deletions, specifically those in the 10–25-kilobase
(kb) range (Supplementary Fig. 6c).
Samples with extreme kataegis burden (more than 30 foci) comprise
four types of focal hypermutation (Extended Data Fig. 6): (1) off-target
somatic hypermutation and foci of T > N at CpTpT, found in B cell
non-Hodgkin lymphoma and oesophageal adenocarcinomas, respectively;
(2) APOBEC kataegis associated with complex rearrangements, notably
found in sarcoma and melanoma; (3) rearrangement-independent
APOBEC kataegis on the lagging strand and in early-replicating regions,
mainly found in bladder and head and neck cancer; and (4) a mix of
the last two types. Kataegis only occasionally led to driver mutations
(Supplementary Table 5).
We identified chromothripsis in 587 samples (22.3%), most
fre-quently among sarcoma, glioblastoma, lung squamous cell
carci-noma, melanoma and breast adenocarcinoma
18. Chromothripsis
increased with whole-genome duplications in most cancer types
(Extended Data Fig. 7a), as previously shown in medulloblastoma
58.
The most recurrently associated driver was TP53
52(pan-cancer odds
ratio = 3.22; pan-cancer P = 8.3 × 10
−35; q < 0.05 in breast lobular (odds
ratio = 13), colorectal (odds ratio = 25), prostate (odds ratio = 2.6) and
hepatocellular (odds ratio = 3.9) cancers; Fisher–Boschloo tests). In
two cancer types (osteosarcoma and B cell lymphoma), women had a
higher incidence of chromothripsis than men (Extended Data Fig. 7b).
In prostate cancer, we observed a higher incidence of chromothripsis
in patients with late-onset than early-onset disease
59(Extended Data
Fig. 7c).
Chromothripsis regions coincided with 3.6% of all identified
driv-ers in PCAWG and around 7% of copy-number drivdriv-ers (Fig. 4d). These
proportions are considerably enriched compared to expectation if
selection were not acting on these events (Extended Data Fig. 7d). The
majority of coinciding driver events were amplifications (58%), followed
by homozygous deletions (34%) and SVs within genes or promoter
regions (8%). We frequently observed a ≥2-fold increase or decrease in
expression of amplified or deleted drivers, respectively, when these loci
were part of a chromothripsis event, compared with samples without
chromothripsis (Extended Data Fig. 7e).
Chromothripsis manifested in diverse patterns and frequencies
across tumour types, which we categorized on the basis of five
charac-teristics (Fig. 4a). In liposarcoma, for example, chromothripsis events
often involved multiple chromosomes, with universal MDM2
ampli-fication
60and co-amplification of TERT in 4 of 19 cases (Fig. 4d). By
contrast, in glioblastoma the events tended to affect a smaller region
on a single chromosome that was distant from the telomere, resulting
in focal amplification of EGFR and MDM2 and loss of CDKN2A. Acral
melanomas frequently exhibited CCND1 amplification, and lung
squa-mous cell carcinomas SOX2 amplifications. In both cases, these drivers
were more-frequently altered by chromothripsis compared with other
drivers in the same cancer type and to other cancer types for the same
driver (Fig. 4d and Extended Data Fig. 7f). Finally, in chromophobe renal
cell carcinoma, chromothripsis nearly always affected chromosome
5 (Supplementary Fig. 7): these samples had breakpoints immediately
adjacent to TERT, increasing TERT expression by 80-fold on average
compared with samples without rearrangements (P = 0.0004; Mann–
Whitney U-test).
Timing clustered mutations in evolution
An unanswered question for clustered mutational processes is whether
they occur early or late in cancer evolution. To address this, we used
molecular clocks to define broad epochs in the life history of each
tumour
49,61. One transition point is between clonal and subclonal
muta-tions: clonal mutations occurred before, and subclonal mutations after,
the emergence of the most-recent common ancestor. In regions with
copy-number gains, molecular time can be further divided according
to whether mutations preceded the copy-number gain (and were
them-selves duplicated) or occurred after the gain (and therefore present on
only one chromosomal copy)
7.
Chromothripsis tended to have greater relative odds of being clonal
than subclonal, suggesting that it occurs early in cancer evolution,
especially in liposarcomas, prostate adenocarcinoma and squamous
cell lung cancer (Fig. 5a). As previously reported, chromothripsis was
especially common in melanomas
62. We identified 89 separate
chromo-thripsis events that affected 66 melanomas (61%); 47 out of 89 events
affected genes known to be recurrently altered in melanoma
63(Sup-plementary Table 6). Involvement of a region on chromosome 11 that
includes the cell-cycle regulator CCND1 occurred in 21 cases (10 out
of 86 cutaneous, and 11 out of 21 acral or mucosal melanomas),
typi-cally combining chromothripsis with amplification (19 out of 21 cases)
(Extended Data Fig. 8). Co-involvement of other cancer-associated
genes in the same chromothripsis event was also frequent, including
Nature | Vol 578 | 6 February 2020 | 89
TERT (five cases), CDKN2A (three cases), TP53 (two cases) and MYC
(two cases) (Fig. 5b). In these co-amplifications, a chromothripsis
event involving multiple chromosomes initiated the process,
creat-ing a derivative chromosome in which hundreds of fragments were
stitched together in a near-random order (Fig. 5b). This derivative
then rearranged further, leading to massive co-amplification of the
multiple target oncogenes together with regions located nearby on
the derivative chromosome.
In these cases of amplified chromothripsis, we can use the inferred
number of copies bearing each SNV to time the amplification process.
SNVs present on the chromosome before amplification will
them-selves be amplified and are therefore reported in a high fraction of
sequence reads (Fig. 5b and Extended Data Fig. 8). By contrast, late
SNVs that occur after the amplification has concluded will be present
on only one chromosome copy out of many, and thus have a low variant
allele fraction. Regions of CCND1 amplification had few—sometimes
zero—mutations at high variant allele fraction in acral melanomas, in
contrast to later CCND1 amplifications in cutaneous melanomas, in
which hundreds to thousands of mutations typically predated
ampli-fication (Fig. 5b and Extended Data Fig. 9a, b). Thus, both
chromoth-ripsis and the subsequent amplification generally occurred very early
during the evolution of acral melanoma. By comparison, in lung
squa-mous cell carcinomas, similar patterns of chromothripsis followed by
SOX2 amplification are characterized by many amplified SNVs,
sug-gesting a later event in the evolution of these cancers (Extended Data
Fig. 9c).
Notably, in cancer types in which the mutational load was sufficiently
high, we could detect a larger-than-expected number of SNVs on an
intermediate number of DNA copies, suggesting that they appeared
during the amplification process (Supplementary Fig. 8).
TERT CCND1
a
b
0 20 40 0 0.5 1.0 C>A C>G C>T T>A T>C T>G 0 40 80 120 0 0.5 1.0 VA F 0 10 20 30 40 50 55 65 75 85 95 105 115 Chr. 5 position (Mb) Chr. 11 position (Mb) 0 20 40 0 0.5 1.0 Copy number Sample: SA557318 Acral melanoma Sample: SA557322 Acral melanoma Sample: SA557416 Acral melanoma VA F Copy number VA F Copy number 0.010.1 1 10 100 0.010.1 1 10 100 Relative odds (clonal/subclonal)Relative odds (early/late)
Fraction of samples Chromoplexy
Chromothripsis Kataegis No. samples 34 23 16 10 38 198 3 13 2 18 41 146 18 89 60 98 57 45 111 33 317 38 48 107 95 13 2 23 113 239 85 210 20 86 1 15 19 75 48 51 Biliar y−AdenoCA
Bladder−TCC Bone−Benign Bone−Epith Bone−Osteosarc Breast−AdenoCA Breast−DCI S Breast−Lob ularCA Cer vix−AdenoCA Cer vix−SCC CNS−GBM CNS−Medullo CNS−Oligo CNS−PiloAstro ColoRect−AdenoCA Eso−AdenoCA Head−SCC Kidne y−ChRCC Kidne y−RCC−Clear Kidne y−RCC−P ap Liv er−HCC Lung−AdenoCA Lung−SCC Lymph−BNHL Lymph−CLL My eloid−AML My eloid−MDS My eloid−MPN Ov ar y−AdenoCA P anc−AdenoCA Pa nc−Endocr ine Prost−AdenoCA Skin−Melanoma−Acra l Skin−Melanoma−Cut Skin−Melanoma−Mucosal SoftTissue−Leio my o SoftTissue−Liposarc Stomach−AdenoCA Th y−AdenoCA Uter us−AdenoCA
Fig. 5 | Timing of clustered events in PCAWG. a, Extent and timing of
chromothripsis, kataegis and chromoplexy across PCAWG. Top, stacked bar charts illustrate co-occurrence of chromothripsis, kataegis and chromoplexy in the samples. Middle, relative odds of clustered events being clonal or subclonal are shown with bootstrapped 95% confidence intervals. Point estimates are highlighted when they do not overlap odds of 1:1. Bottom, relative odds of the events being early or late clonal are shown as above. Sample
sizes (number of patients) are shown across the top. b, Three representative patients with acral melanoma and chromothripsis-induced amplification that simultaneously affects TERT and CCND1. The black points (top) represent sequence coverage from individual genomic bins, with SVs shown as coloured arcs (translocation in black, deletion in purple, duplication in brown, tail-to-tail inversion in cyan and head-to-head inversion in green). Bottom, the variant allele fractions of somatic point mutations.
90 | Nature | Vol 578 | 6 February 2020
Germline effects on somatic mutations
We integrated the set of 88 million germline genetic variant calls
with somatic mutations in PCAWG, to study germline determinants
of somatic mutation rates and patterns. First, we performed a
genome-wide association study of somatic mutational processes with common
germline variants (minor allele frequency (MAF) > 5%) in individuals
with inferred European ancestry. An independent genome-wide
associ-ation study was performed in East Asian individuals from Asian cancer
genome projects. We focused on two prevalent endogenous
muta-tional processes: spontaneous deamination of 5-methylcytosine at
CpG dinucleotides
5(signature 1) and activity of the APOBEC3 family of
cytidine deaminases
64(signatures 2 and 13). No locus reached
genome-wide significance (P < 5 × 10
−8) for signature 1 (Extended Data Fig. 10a,
b). However, a locus at 22q13.1 predicted an APOBEC3B-like
mutagen-esis at the pan-cancer level
65(Fig. 6a). The strongest signal at 22q13.1
was driven by rs12628403, and the minor (non-reference) allele was
protective against APOBEC3B-like mutagenesis (β = −0.43, P = 5.6 × 10
−9,
MAF = 8.2%, n = 1,201 donors) (Extended Data Fig. 10c). This variant
tags a common, approximately 30-kb germline SV that deletes the
APOBEC3B coding sequence and fuses the APOBEC3B 3′ untranslated
region with the coding sequence of APOBEC3A. The deletion is known
to increase breast cancer risk and APOBEC mutagenesis in breast
can-cer genomes
66,67. Here, we found that rs12628403 reduces
APOBEC3B-like mutagenesis specifically in cancer types with low levels of APOBEC
mutagenesis (β
low= −0.50, P
low= 1 × 10
−8; β
high= 0.17, P
high= 0.2), and
increases APOBEC3A-like mutagenesis in cancer types with high
lev-els of APOBEC mutagenesis (β
high= 0.44, P
high= 8 × 10
−4; β
low= −0.21,
P
low= 0.02). Moreover, we identified a second, novel locus at 22q13.1
that was associated with APOBEC3B-like mutagenesis across cancer
types (rs2142833, β = 0.23, P = 1.3 × 10
−8). We independently validated the
association between both loci and APOBEC3B-like mutagenesis using
East Asian individuals from Asian cancer genome projects
(β
rs12628403= 0.57, P
rs12628403= 4.2 × 10
−12; β
rs2142833= 0.58, P
rs2142833= 8 × 10
−15)
(Extended Data Fig. 10d). Notably, in a conditional analysis that
accounted for rs12628403, we found that rs2142833 and rs12628403
are inherited independently in Europeans (r
2<0.1), and rs2142833
remained significantly associated with APOBEC3B-like mutagenesis
in Europeans (β
EUR= 0.17, P
EUR= 3 × 10
−5) and East Asians (β
ASN= 0.25,
P
ASN= 2 × 10
−3) (Extended Data Fig. 10e, f). Analysis of donor-matched
expression data further suggests that rs2142833 is a cis-expression
quantitative trait locus (eQTL) for APOBEC3B at the pan-cancer level
(β = 0.19, P = 2 × 10
−6) (Extended Data Fig. 10g, h), consistent with
cis-eQTL studies in normal cells
68,69.
1 2 3 4 5 6 7 8 9 10 11 12 13 14 15 16 17 18 19 2021 22 X 22q13.1a
c
(1) (2) (3) (4)b
d
–log 10 (P ) Chromosomes –log 10(Pexp) –log 10 (Pobs ) 0 0.5 1.0 1.5 2.0 2.5 3.0 0 1 2 3 4 5 6 7 8 BRCA2 MBD4 5 Long read (kb) Chr. 2: 59,279,205–59,289,368 Chr. 5: 14,8202,017–148,202,8051
2
3a
3b
0 10 Chr. 2 Chr. 5 Chr. 2Chr. 5 Germline Tumour 1 2 3 Short reads 1 2 3 4 5 6 7 8 9 10 11 12 13 14 15 16 17 1819202122 1 2 3 4 5 6 7 8 9 10 Contribution (%) 0 1 5 ≥10 Volcano size Strombolian Plinian Not hotChromosome
Interchromosomal Deletion
Duplication Inversion (tail-to-tail) Inversion (head-to-head) Prost–AdenoCA (DO51965) 1 2 3 4 5 6 7 8 9 10 11 X 22 21 20 19 18 17 16 15 14 13 12 Y
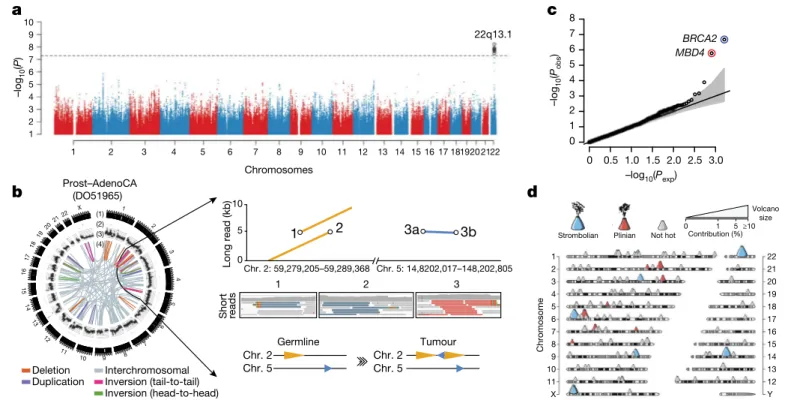
Fig. 6 | Germline determinants of the somatic mutation landscape. a, Association between common (MAF > 5%) germline variants and somatic
APOBEC3B-like mutagenesis in individuals of European ancestry (n = 1,201). Two-sided hypothesis testing was performed with PLINK v.1.9. To mitigate multiple-hypothesis testing, the significance threshold was set to genome-wide significance (P < 5 × 10⁻⁸). b, Templated insertion SVs in a
BRCA1-associated prostate cancer. Left, chromosome bands (1); SVs ≤ 10 megabases (Mb) (2); 1-kb read depth corrected to copy number 0–6 (3); inter- and intrachromosomal SVs > 10 Mb (4). Right, a complex somatic SV composed of a 2.2-kb tandem duplication on chromosome 2 together with a 232-base-pair (bp) inverted templated insertion SV that is derived from chromosome 5 and inserted inbetween the tandem duplication (bottom). Consensus sequence alignment of locally assembled Oxford Nanopore Technologies long sequencing reads to chromosomes 2 and 5 of the human reference genome (top). Breakpoints are circled and marked as 1 (beginning of tandem
duplication), 2 (end of tandem duplication) or 3 (inverted templated insertion). For each breakpoint, the middle panel shows Illumina short reads at SV
breakpoints. c, Association between rare germline PTVs (MAF < 0.5%) and somatic CpG mutagenesis (approximately with signature 1) in individuals of European ancestry (n = 1,201). Genes highlighted in blue or red were associated with lower or higher somatic mutation rates. Two-sided hypothesis testing was performed using linear-regression models with sex, age at diagnosis and cancer project as variables. To mitigate multiple-hypothesis testing, the significance threshold was set to exome-wide significance (P < 2.5 × 10⁻⁶).
The black line represents the identity line that would be followed if the observed P values followed the null expectation; the shaded area shows the 95% confidence intervals. d, Catalogue of polymorphic germline L1 source elements that are active in cancer. The chromosomal map shows germline source L1 elements as volcano symbols. Each volcano is colour-coded according to the type of source L1 activity. The contribution of each source locus (expressed as a percentage) to the total number of transductions identified in PCAWG tumours is represented as a gradient of volcano size, with top contributing elements exhibiting larger sizes.