1. INTRODUCTION
Hearing impaired persons have increased HL threshold curves over audio frequency band, so that their hearing impairments may be partly compensated by HAs. Before 1990s analog HAs dominated HA markets even though analog HAs are limited in the HL compensation because they are not modifiable. In analog ITE(In-The-Ear) type HAs a logarithmic volume control switch is the only way of modification. There were some conventional fitting formulas developed for better choice of amplification and compression [1]. The advent of the sophisticated semiconductor technology as well as the better understanding of the hearing physiology opened the age of digital HAs last decade. Digital HAs are modifiable, that is, each different type of hearing impairment can be precisely compensated with the same class of the digital HA. These multi-purposed digital HAs are possible by adopting DSP based IC chip design and manufacturing. DSP chips for digital HAs are divided into two categories; specific DSP chip and general DSP chip. The specific HA DSP chip was produced earlier because the miniature size of the chip package was required for ITE type HA fabrication [2]. Recently, general DSP chips are getting down in packaging size with lower power consumption, so as to be applied to ITE type HAs [3, 4]. As digital HAs support more functions and flexibilities, the fitting method of the digital HAs becomes important issues in the hearing aid market. This paper applies a specific DSP chip such as Gennum GB3211 (Fig. 1) to digital HA fabrication and shows the result of the optimal parameter fitting program development for the chip.
The main features of GB3211 are 4 channel nonlinear compressive active filtering and 4 extra linear biquad filtering. Those 8 active digital filters are used for fitting of various patterns of HL threshold curves. In this paper a GB3211 chip fitting program was developed for digital HAs in which the most optimal DSP chip parameters were selected from 4.7 billion combinations of possible parameters.
2. DSP PARAMETER FITTING PROCEDURES
AND RESULTS
Fig. 2 shows the initial menu window of the present digital
HA fitting program. The whole procedure of the parameter fitting is charted in Fig. 3.
Fig. 1 Circuit diagram of GB3211(GB3210) digital HA specific DSP chip [2]
Fig. 2 The initial menu window of the digital HA fitting Program
2.1 Audiogram Hearing Threshold
The first step of the parameter fitting is to read the
HL threshold of the hearing impaired person (Fig. 4).
Digital Hearing Aid DSP Chip Parameter Fitting Optimization
Soon Suck Jarng*, You Jung Kwon*, Je Hyung Lee**
*Dept. of Information, Control & Instrumentation, Chosun University, South Korea
(Tel : +82-62-230-7107; E-mail: ssjarng@chosun.ac.kr)
**Dept. of Information, Control & Instrumentation, Chosun University, South Korea
(Tel : +82-62-230-7767; E-mail: email@minmay.biz)
Abstract:DSP chip parameters of a digital hearing aid (HA) should be optimally selected or fitted for hearing impaired persons. The more precise parameter fitting guarantees the better compensation of the hearing loss (HL). Digital HAs adopt DSP chips for more precise fitting of various HL threshold curve patterns. A specific DSP chip such as Gennum GB3211 was designed and manufactured in order to match up to about 4.7 billion different possible HL cases with combination of 7 limited parameters. This paper deals with a digital HA fitting program which is developed for optimal fitting of GB3211 DSP chip parameters. The fitting program has completed features from audiogram input to DSP chip interface. The compensation effects of the microphone and the receiver are also included. The paper shows some application examples.
Audiogram Read Audiogram
Choose Auto Fitting Algorithm Auto Fitting
Apply Fitting Formula (Fig6)
Set DSP Parameters
Bi-Quad Filter I/O Curve
Volume Control &
Feedback Reduction Set Warning Sound Set Directivity • Bi-Quad Filter
• Equalizer • Direct
Parameter Input
• Lower Threshold • Low Level Gain • Upper Threshold • High Level Gain • AGCo • Squelch • Crossover Freq.
• Wideband Gain • Volume Control • Ext. Volume Control • Mute • Notch Depth • Notch Center • Notch Width • Tone Frequency • Tone Level • Mem Tone Freq. • Mem Tone Level • HRX • Low Battery
• Attack & Release Time (Ch 1~4, AGCo, Squelch) • Front Wave Mode • Beta • Low Freq Eq • Mt Mic Atten Copy Parameters
GB3211 Control
Read Write Burn
Open, Which Chip, Init Select Programmer Kit
Select Right /Left, Memory M1~M4
Fig. 3 The flow chart of the parameter fitting.
Fig. 4 Air conduction HL thresholds. x(Left Ear), o(Right Ear).
2.2 Fitting Formula
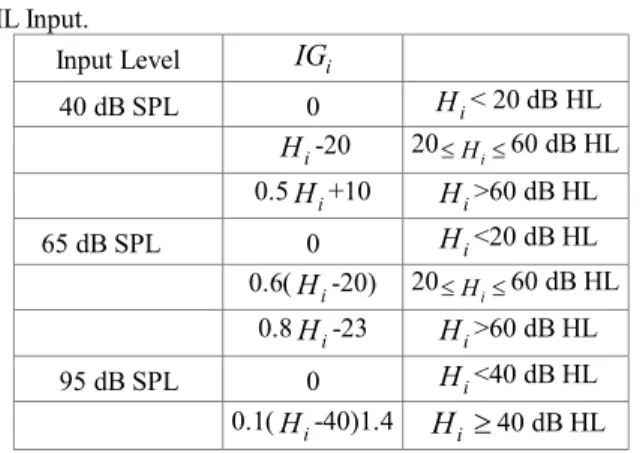
The second step is to calculate the HA amplification as a function of frequency by a conventional fitting formula such as ‘FIG6’. Table 1 shows the nonlinear ‘Fig6’ Formula [1]. Table 1 Nonlinear ‘FIG6’ Formula [1]. IGi = Gain.
H
i = HL Input. Input LevelIG
i 40 dB SPL 0 Hi< 20 dB HL i H -20 20£Hi£60 dB HL 0.5Hi+10 Hi>60 dB HL 65 dB SPL 0 Hi<20 dB HL 0.6(Hi-20) 20£Hi£60 dB HL 0.8Hi-23 Hi>60 dB HL 95 dB SPL 0 Hi<40 dB HL 0.1(Hi-40)1.4H
i³
40 dB HL Fig. 5 shows the amount of the HA amplification function derived from the nonlinear ‘FIG6’ formula. The three continuous black thin lines of the figure indicates how much amplification should be done by the HA amplifier for three different input sound levels. As the input sound level is bigger,the relative increment of the amplification becomes smaller because of nonlinearity. If any analog amplification chip can produce the similar nonlinear frequency response as the figure for a particular hearing impaired person, the analog chip is specifically good enough for the person. However every hearing impaired person have each different amplification requirement, so that each person has to have his/her own specific analog chip. That is very uneconomical. Digital HA chips are designed to adapt to such diverse requirements
.
(a) Left Ear
Fig. 5 HA amplification function derived from the nonlinear ‘FIG6’ formula.
2.3 DSP chip parameters’ fitting
The third step is to calculate DSP chip parameters for fitting to the HA amplification function. The word, fitting, is sometimes confused. In general ‘fitting’ means fitting formula as in the second step. The parameter fitting in the third step means the proper adjustment of the DSP chip parameters in order for the DSP chip to resemble to the HA amplification function derived by the second step. Fig. 6 shows the results of the fitting formula (three black thin lines) and the parameter fitting (three colored thick lines) by a fitting program supplied by Gennum Co. The blue line is for 40dB input sound level, and the green and the violet lines are for 60dB and 80dB input sound levels respectively. The parameter fitting seems to be all right at low frequency bands, but the parameter fitting is not well resemble to the HA amplification functions at high frequency bands. Therefore this paper tried better parameter fitting than Gennum’s.
(a) Left Ear
Fig. 6 The results of the fitting formula (thin lines) and the parameter fitting (thick lines) by a fitting program supplied by Gennum Co. Blue: 40dB Input Level, Green: 60dB Input Level, Violet: 80dB Input Level.
DSP chip, some better optimal parameter fitting method could be resulted. The Gennum 3211 chip divides the frequency band into four channels. Each channel boundary is defined as cross frequency, CO, (Fig. 7). In Fig. 7 the red thick line indicates a HA amplification function. Each channel of Fig. 7 is controlled by each digital filter; CH1=Low Pass (LP) Filter, CH2=Band Pass (BP) Filter, CH3= Band Pass (BP) Filter, CH4= High Pass (HP) Filter [5]. The four digital filter responses are summed to resemble to the HA amplification function.
Fig. 7 Four channels separately formed by four digital filters. The four digital filter responses are summed to resemble to the HA amplification function.
The channel digital filter is Butterworth type. The first channel is composed by the third order low pass
filters, 2 1 3 ÷øö ç è æ =co cf rd
LP .
cf
is cut-off frequency andco
1
isthe first cross frequency. The second channel is composed by second order high pass filters as well as third/fourth order low pass filters,
(
HP
2ndcf=co1´
LP
4thcf=co2) (
´
HP
2ndcf=co1´
LP
3rdcf=co2)
.The third channel is composed by third/fifth order high pass filters as well as second/third order low pass filters,
(
HP
3rd cf=co2´
LP
2nd cf=co3) (
´
HP
5thcf=co2´
LP
3rd cf=co3)
. The fourth channel is composed by second/fifth order highpass filters,
(
) (
)
3 5 3 2nd cf coHP
th cf coHP
=´
= .Table 2 Butterworth digital filter formula. N is a number of order [5].
N
N
th-order Low-Pass Filter thN
-order High-Pass FilterEven
Õ
= + + = /2 1 2 2 2 cos 2 ) ( N k c k c c s s s H w f w wÕ
= + + =/2 1 2 2 2 cos 2 ) ( N k s c ks c s s H w f wOdd
Õ
-= + + + = ( 1)/2 1 2 2 2 cos 2 ) ( N k c k c c c c s s s s H w f w w w wÕ
-= + + + = (1/)2 1 2 2 2 cos 2 ) ( N k c k c c s s s s s s H w f w wGennum 3211 chip has three cross frequency parameters and each CF parameter is aligned with 16~19 fixed frequencies (Table 3). Also each channel has four parameters; LTH(Low Threshold), LLGAIN(Low Level Gain), UTH(Upper Threshold), HLGAIN(High Level Gain) which are used for nonlinear compression (Fig. 8, Table 4)
.
Table 3 Gennum 3211 chip’s three cross frequencies
aligned with 16~19 fixed frequencies. [kHz].
CF1 0.3 0.315 0.335 0.355 0.375 0.4 0.425 0.45 0.475
CF2 0.71 0.75 0.8 0.85 0.9 0.95 1
1.06 1.12
CF3 2 2.12 2.24 2.37 2.5 2.65 2.8
3 3.15
0.5 0.53 0.56 0.6 0.63 0.67 0.71
1.18 1.25 1.33 1.4 1.5 1.6 1.7 1.8 1.9
2
3.35 3.55 3.75 4 4.25 4.5 4.75 5
Fig. 8 Nonlinear compression relationship between input sound level and output sound level. LTH(Low Threshold), LLGAIN(Low Level Gain), UTH(Upper Threshold), HLGAIN(High Level Gain).
Table 4 Nonlinear compression fixed parameters [dB] LTH1 30 + 2n (n=0 to 35) LTH2 30 + 2n (n=0 to 35) LTH3 30 + 2n (n=0 to 35) LTH4 30 + 2n (n=0 to 35) LLGAIN1 -18 + 2n (n=0 to 30) LLGAIN2 -18 + 2n (n=0 to 30) LLGAIN3 -18 + 2n (n=0 to 30) LLGAIN4 -18 + 2n (n=0 to 30) UTH1 40 + 2n (n=0 to 35) UTH2 40 + 2n (n=0 to 35) UTH3 40 + 2n (n=0 to 35) UTH4 40 + 2n (n=0 to 35) HLGAIN1 -18 + 2n (n=0 to 30) HLGAIN2 -18 + 2n (n=0 to 30) HLGAIN3 -18 + 2n (n=0 to 30) HLGAIN4 -18 + 2n (n=0 to 30)
The initial minimum number of parameters for the parameter fitting are CF1(16), CF2(19), CF3(17), LLGAIN1(31), LLGAIN2(31), LLGAIN3(31), LLGAIN4(31) which generate 4.7 billion possible combinations of parameters (4.7 billion
»
16x19x17x31x31x31x31). Those seven DSP chip parameters may be optimally calculated by mean square method which minimizes the difference between the desired HA amplification function and the amplitude response curve derived by applying different parameter sets. The input frequency is a variable and we limit the number of the input frequency for faster calculation. Fig. 9 shows the results of the fitting formula (three black thin lines) and the parameter fitting (three colored thick lines) by a fitting program developed by authors. In comparison with Fig. 6 the optimal parameter fitting seems to be better at all frequency bands than Gennum’s(a) Left Ear.
Fig. 9 The results of the fitting formula (thin lines) and the optimal parameter fitting (thick lines) by a fitting program developed by authors. Blue: 40dB Input Level, Green: 60dB Input Level, Violet: 80dB Input Level.
2.4 Compensation for the microphone and the receiver The fourth step is to remove the resonance effects of the microphone and the receiver. Fig. 10 shows the frequency responses of the microphone and the receiver respectively. (a) EM4346 microphone
(b) ED3146SAT receiver (Sonicmicronics Co.)
Fig. 10 Frequency responses of the microphone and the receiver. Dotted lines are truncated responses.
If the resonance effects of the microphone and the receiver are added to the optimal parameter fitting, the resultant response curves are shown in Fig. 11. The summed resonance effects of the microphone and the receiver result in the feedback of the ITE type HAs. Therefore the Gennum 3211 DSP chip has another four extra biquad digital filters for the compensation of the feedback resonance effects (Fig. 12)
.
(a) Left Ear
Fig. 11 The results of the fitting formula (thin lines) and the optimal parameter fitting (thick lines) with the resonance effects of the microphone and the receiver. Blue: 40dB Input Level, Green: 60dB Input Level, Violet: 80dB Input Level.
Each biquad digital filter is designed by a second order IIR (Infinite Impulse Response) digital filter as shown in Fig. 13 [6].
The coefficients of the digital biquad filter are dereived from the coefficients of the analog biquad filter
(
~2 2 ~1 ~0) (
/~2 2 ~1 ~0)
)
(s b s bs b a s as a
H = + + + + where
w
c is acenter/cut-off angular frequency,
A
is an amplification ratio(
A
>
0
.
0
),Q
is a quality factor (0.7079 ~ 100). The coefficients of the digital biquad filter are limited between –2 and +2 because of 215 bits’ signed resolution limit. ThereforeA
andQ
should be adjusted to be within the limit(a) Left Ear
Fig. 12 Four biquad digital filters are extra filters for the compensation of the feedback resonance effects.
(a) (b) 2 2 1 1 2 2 1 1 0 1 ) ( - -+ + + + = Z a Z a Z b Z b b z H
Fig. 13 The structure (a) and the formula (b) of the digital biquad filter.
-
2
<
b
0,
b
1,
b
2,
a
1,
a
2<
+
2
.Table 5 The coefficients of the analog biquad filter
(
~2 2 ~1 ~0) (
/~2 2 ~1 ~0)
)(s b s b s b a s a s a
H = + + + + [6]
Filter Type Amplification
Ratio
A
2~
b
b
~
1A
£
0
.
1
2 cw
w c Q EQ filter (Parametric Equalizer)0
.
1
0
<
A
<
2 cw
(
A
´
w
c)
Q
LP filter0
<
A
0.0 0.0 HP filter0
<
A
0.0A
BP filter0
<
A
0.0(
A
´
w
c)
Q
A
£
0
.
1
1.0 2´wc A LF Shelf filter0
.
1
0
<
A
<
1.0 cw
´ 2A
£
0
.
1
A
2´wc´A HF Shelf filter0
.
1
0
<
A
<
1.0 2´wc0
~
b
a
~
2~
a
1a
~
0 0.0 1.0w
c(
Q
´
A
)
2 cw
0.0 1.0w
c Q 2 cw
2 cA
´
w
1.0w
c Qw
c2 0.0 1.0w
c Q 2 cw
0.0 1.0w
c Q 2 cw
2
c
A
´
w
1.02
´
w
cw
c2 2 cw
1.0 2´w
c A wc2/A 2 cw
1.0 cw
´
2
2 cw
2 cw
1
/
A
2´w
c A wc2/AThe bilinear transformation from S domain to Z domain,
(
~2 2 ~1 ~0) (
~2 2 ~1 ~0)
) (s b s b s b a s a s a H = + + ¸ + +(
0 2 1 2) (
2 1 2)
) (z b z bz b z az a H = + + ¸ + + , is done as flowing equations; 2 0 1 2 2 0 1 2 0 ~ ~ 2 ~ 4 ~ ~ 2 ~ 4 T a T a a T b T b b b ´ + ´ ´ + ´ ´ + ´ ´ + ´ = (Equation 1) 2 0 1 2 2 2 0 1 ~ ~ 2 ~ 4 ~ 8 ~ 2 T a T a a b T b b ´ + ´ ´ + ´ ´ -´ ´ = (Equation 2) 2 0 1 2 2 0 1 2 2 ~ ~ 2 ~ 4 ~ ~ 2 ~ 4 T a T a a T b T b b b ´ + ´ ´ + ´ ´ + ´ ´ -´ = (Equation 3) 2 0 1 2 2 2 0 1 ~ ~ 2 ~ 4 ~ 8 ~ 2 T a T a a a T a a ´ + ´ ´ + ´ ´ -´ ´ = (Equation 4) 2 0 1 2 2 0 1 2 2 ~ ~ 2 ~ 4 ~ ~ 2 ~ 4 T a T a a T a T a a a ´ + ´ ´ + ´ ´ + ´ ´ -´ = (Equation 5) where T =tan(
(
p
´ fc)
¸ fs) (
¸p
´ fc)
, sf
=3200 [Hz] Fig. 14 shows the results of the optimal parameter fitting with the resonance effects’ cancellation of the microphone and the receiver by four extra biquad filters. In comparison with Fig. 11, Fig. 14 shows more precise fitting to the fitting formula curves than Fig. 11. Fig. 15 shows the nonlinear input-to-output compression curves for four different frequencies. And Fig. 16 shows nonlinear output sound pressure levels against input sound pressure levels as functions of frequency.(a) Left Ear
Fig. 14 The results of the fitting formula (thin lines) and the optimal parameter fitting (thick lines) with the resonance effects’ cancellation of the microphone and the receiver by four biquad filters. Blue: 40dB Input Level, Green: 60dB Input Level, Violet: 80dB Input Level.
(a) Left Ear
Fig. 15 Nonlinear input/output compression curves for four different frequencies.
(a) Left Ear
Fig. 16 Nonlinear output sound pressure levels (dB SPL) against input sound pressure levels as functions of frequency. 2.5 Compensation for the ear canal resonance
The fifth step is to compensate the insertion loss of the ear canal resonance effect. When an ITE HA is inserted inside an ear canal, the ear canal is blocked with the ITE HA. Then the insertion loss of the ear canal resonance effect happens. Therefore a digital HA should consider the compensation of the insertion loss. The main frequency band of the canal resonance is 1~4 kHz. For this reason the audiogram may be modified as shown in Fig. 17.
Fig. 17 Audiograms (a) without and (b) with the compensation of the insertion loss. x(Left Ear), o(Right Ear).
Fig. 18 (b) shows the results of the optimal parameter fitting with the resonance effects’ cancellation of the microphone and the receiver by four extra biquad filters as well as with the compensation of the left ear canal resonance effect.
Left Ear
(a) without ear canal compensation
(b) with ear canal compensation
Fig. 18 The results of the fitting formula (thin lines) and the optimal parameter fitting (thick lines) with the resonance effects’ cancellation of the microphone and the receiver by four biquad filters as well as with the compensation of the left ear canal resonance effect. Blue: 40dB Input Level, Green: 60dB Input Level, Violet: 80dB Input Level.
And Fig. 19 (b) shows the results of the optimal parameter fitting with the resonance effects’ cancellation of the microphone and the receiver by four extra biquad filters as well as with the compensation of the right ear canal resonance effect.
(b) with ear canal compensation
Fig. 19 The results of the fitting formula (thin lines) and the optimal parameter fitting (thick lines) with the resonance effects’ cancellation of the microphone and the receiver by four biquad filters as well as with the compensation of the right ear canal resonance effect. Blue: 40dB Input Level, Green: 60dB Input Level, Violet: 80dB Input Level.
3. CONCLUSION
This paper applies a specific DSP chip such as Gennum GB3211 to digital ITE type HA fabrication and shows the result of the optimal parameter fitting program development for the chip. Details of chip parameters are explained. The fitting program has completed features from audiogram input to DSP chip interface. The compensation effects of the microphone and the receiver are also included. The comparison between Fig. 6 and Fig. 9 shows that the DSP chip parameters such as 4.7 billion possible combinations of parameters should be optimally chosen to resemble to the amount of hearing threshold compensation derived by the fitting formula. Extra digital filters need to be added for the complete fitting to the HA amplification function. Even though the present DSP chip parameter fitting program provides the best fitting for the fitting formula, the final precise fitting should be manually adjusted by the user, that is, the hearing impaired person [7,8].
ACKNOWLEDGMENT
This study was supported by research fund from the ministry of commerce, industry and energy (MOCIE Korea) standardization technology development project(standardization study on digital hearing aid: project number 10016821) in 2004.
REFERENCES
[1] Harvey Dillon, "Hearing Aids", Printed by Thieme, 2001. [2]http://www.gennum.com/hip/dproducts/paragon/gb3211.ht
m
[3] http://www.gennum.com/hip/dproducts/duet/gb3212.htm [4]http://www.dspfactory.com/technology/signaklaratechnolog y.html
[5] Chaewook Lee, “Recent digital signal processing”, published by BooksHill Co., 2002.
[6] Gennum Co., “Biquad filters in PARAGON digital hybrid”, Doc. No. 20205-1, 2001.
[7] B. Kollmeier and V. Hohmann, "Loudness estimation and compensation employing a categorical scale," in Advances in
Hearing Research, G. A. Manley, G. M. Klump, C. Köppl, H.
Fastl, and H. Oeckinghaus, Eds. Singapore: World Scientific, pp. 441-451. 1995.

![Table 2 Butterworth digital filter formula. N is a number of order [5]. N N th -order Low-Pass Filter thN -order High-Pass Filter Even Õ = + +=/212 22cos2)(Nk c k ccsssHwfww Õ= + +=/212 22cos2)(Nks c k s cssHwfw Odd Õ -= + ++=(1)/2 1 2 22](https://thumb-ap.123doks.com/thumbv2/123dokinfo/4893013.37352/3.892.114.397.297.501/table-butterworth-digital-formula-filter-filter-ccssshwfww-csshwfw.webp)


