1. INTRODUCTION
Holographic Data Storage System[1], one of the next generation data storage principle, is a 2-dimensional page oriented memory using volume hologram in writing and retrieving process. In the HDS system, data management procedure is performed in parallel so fast data transfer rate can be realized. And the system store data in binary form (0 or 1), so that computers can use the digital data directly. In writing procedure, Laser of specific wavelength passes through a Spatial Light Modulator (SLM) to make 2-dimensional data page. A digital data 0 makes image of a black pixel (off-pixel) by blocking the light on SLM and digital data 1 is imaged as a white pixel (on-pixel) on CCD camera.
Diffraction, the nature of light, makes the laser which passes through an on-pixel surrounded by off-pixels on SLM to affect surrounding pixels by 2-dimensional Fourier Transform of a plane wave and when retrieving process the effects to surrounding pixels of an on-pixel are photographed by CCD camera and cause errors to binary data.
In this paper, we analyze the effect of an on-pixel (digital data 1) to surrounding off-pixels (digital data 0) and suggest a new method for reducing errors of binary data using two clustering methods. The error reduction algorithm is that ; find centers of on-pixel group and reduce the effect of on-pixels. To find centers of on-pixel groups, subtractive clustering and C-mean clustering algorithms are used. Figure 1 is the HDS system experiment booth.
G
Fig. 1 HDS system experiment booth
2. IPI NOISE AND CLUSTERING ALGORITHM 2.1 IPI noise
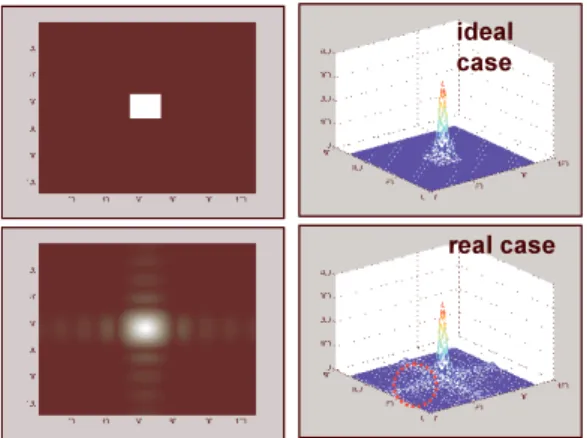
By the Fraunhofer diffraction theory, the beam from the laser source emits as a plane wave. However after crossing the aperture – SLM, the beam propagates as a spherical wave from many point sources and diffracts. The on-pixels of SLM allow the beam to pass through, but the off-pixels do not. So an on-pixel acts like as an aperture, and the beam through the on-pixel of SLM will affect to surrounding pixels by two-dimensional Fourier Transform[2]. This effect acts as one of main noises, and is called “Inter Pixel Interference” noise.
Inter Pixel Interference (IPI) degrades the performance of the channel, and it tends to occur when an off-pixel is surrounded by on-pixels or vice versa. Where there are many on-pixels in comparison, errors from IPI noise will appear relatively high than other area of data page. Therefore if we find the cluster of on-pixels and reduce the intensities of the on-pixels, the possibility of error by IPI noise will decrease than before. And about the whole data page because the intensity of laser of brighter area will be decreased, uniform intensity profile will be obtained.
The IPI noise from two-dimensional Fourier transform is shown in figure 2. ideal case real case ideal case real case ٻ Fig. 2 Inter Pixel Interference
Design and Comparison of Error Correctors Using Clustering in Holographic
Data Storage System
Sang-Hoon Kim*, Jang-Hyun Kim**, Hyun-Seok Yang*** and Young-Pil Park*** * Department of Mechanical Engineering, Yonsei University, Seoul, Korea
(Tel : +82-2-2123-4677; E-mail: [email protected]) **Department of Electrical Engineering, Yonsei University, Seoul, Korea
(Tel : +82-2-2123-4677; E-mail: [email protected])
Abstract: Data storage related with writing and retrieving requires high storage capacity, fast transfer rate and less access time in. Today any data storage system can not satisfy these conditions, but holographic data storage system can perform faster data transfer rate because it is a page oriented memory system using volume hologram in writing and retrieving data. System architecture without mechanical actuating part is possible, so fast data transfer rate and high storage capacity about 1Tb/cm3 can be realized. In this paper, to correct errors of binary data stored in holographic digital data storage system, find cluster centers using clustering algorithm and reduce intensities of pixels around centers. We archive the procedure by two algorithms of C-mean and subtractive clustering, and compare the results of the two algorithms. By using proper clustering algorithm, the intensity profile of data page will be uniform and the better data storage system can be realized.
Keywords: Holographic, Subtractive Clustering, C-mean Clustering, Data Storage
ICCAS2005 June 2-5, KINTEX, Gyeonggi-Do, Korea
ICCAS2005 June 2-5, KINTEX, Gyeonggi-Do, Korea
2.2 C-mean clustering
To find a region where there are many on-pixels in comparison, two algorithms are used and one of them is C-mean clustering.
Clustering is a method to divide distributed data into several groups. Data in the same group have similar characteristics and groups are divided by their average properties[3-4].
Clustering can be considered as connecting data set X with a matrix U , and expressed U . In C-mean clustering X
algorithm, to obtain optimal U the target function is X
summation of squared errors in generalized group like this ;
( )
( )
2 1 1 , n n m , 1 m kj j k j k J U v u x v m = = =∑ ∑
− ≤ ≤ ∞ (1) jx is d -dimensional measured data and vk is d -dimensional th
k cluster center. One of the features of fuzzy clustering is that one can control the ambiguity of the equation by setting the value of m freely larger than 1. The parameters u and kj vkfor local minimum of the equation (1)
are set to ˆu and ˆkj vk. Here, for m > , the next equation is 1
satisfied.ٻ 1 2 1 1 ˆ ˆ , , ˆ c m j k kj r j r x v u j k x v − − = − = ∀ −
∑
(2)( )
( )
1 1 ˆ ˆ , ˆ n m kj j j k n m kj j u x v k u = = =∑
∀∑
(3) Repeating the next process, ˆu making equation (1) to be kjlocal minimum can be obtained.
Step 1 : Assume m and c (number of clusters) and define the norm by equation (2). Set U( )0
, the initial value of U , properly.( U( )0
can be chosen randomly without conscious of u ) kj
Step 2 : Calculate cluster center ( )0 k v using U( )0 and equation (3). Step 3 : Calculate U( )1 using ( )0 k v and equation (2). Step 4 : Define critical value ε and iterate above
processes until U( )p U( )p1
ε
−
− ≤ .
2.3 Subtractive clustering
Subtractive clustering algorithm[4-5] defines the data as cluster center with the maximum of potential values, calculated by the function inversely proportional with the distance between each data with another. By the definition, the data with many neighborhoods has large potential value. Thus determine the data with the largest potential value as the cluster center, and the next cluster center should be
determined without the effect of previous cluster center. This process will iterate until the potential value becomes smaller than pre-defined value.
The step of data clustering with subtractive clustering algorithm is indicated here. The input is n-dimensional vector
1, ,2 N
x x Lx , and the output is one-dimensional vector
1, 2, , N
z z L z , than the input-output data can be indicated by the input-output vector with N-numbers X X1, 2, ,L XN in
(
n + -dimensional input-output space. 1)
Step 1 : Normalize all data from 0 to 1 Step 2 : Calculate the potential of each data
(
2)
1 exp || || , 1, 2, , N i i j i P α X X i N = =∑
− − = L (4)Step 3 : Determine the largest potential value of P as i
*
i
P , and determine the data related with *
i
P as the first cluster center *
1
X
Step 4 : Calculate potential value '
i
P except for effect of the first cluster center
(
)
' * * 2 1 exp || 1 || i i i P =P−P −β X −X (5) where 2 4 / bβ = γ and γb > so that the next cluster γa
center would not appear near the current cluster center Step 5 : Determine the largest value of '
i
P as *
2
P , and determine the data related with *
2
P as the second cluster center *
2
X . Generally calculate potential value '
i
P after removing the k th cluster center *
k
X and determine the data for the largest potential value as cluster center *
1 k X + .
(
)
' * * 2 exp || || i i k i k P =P−P −β X −X (6)Step 6 : Stop iterating if * * 1 / k P P ≤ε. If * * 1 / k P P ≥ε, or * * 1 / k P P >ε and * min * 1 1 k a P d P γ
+ ≥ than determine that as cluster center and repeat Step 5. If * *
1 / k P P >ε and * min * 1 1 k a P d P γ
+ < than set the * k
X as 0 and after determining the second largest potential value, determine that data as the new cluster center if
* min * 1 1 k a P d P γ + ≥ and repeat Step 5. Where, 2 4 / a
a= γ and γa is small positive real number
less than 1 so that data out of the radius γa can effect to
potential value little. Step 6 is the process for determination about selection of the calculated cluster center. Parameter
ICCAS2005 June 2-5, KINTEX, Gyeonggi-Do, Korea
min
d expresses the shortest distance among determined cluster centers * * *
1, 2 , , k
X X L X . Under the process for determination of cluster center, it makes data to be determined as a cluster center with large dmin though it has small potential value to
establish upper bound ε and lower bound ε . 3. SIMULATIONS AND RESULTS
The picture wanted to be stored is the Lenna picture in figure 3. Size of the picture is 120x90 pixels and 256 level gray-scaled.
Fig.3 The picture wanted to be stored
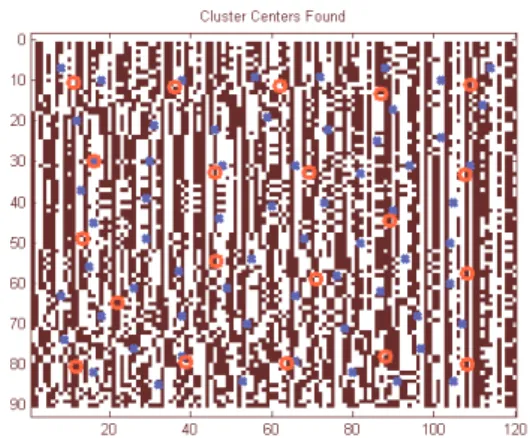
When converted to digital data the picture becomes 90x960 pixels and by 6:8 balanced coding method, it expanded to 90x1280 digital pixels array. To displayed on SLM the digital data array divided into eleven digital data pages with ten data page with 90x120 pixels and one data page with 90x80 pixels. The error correction process will be applied to all data pages, but the processes are equal about 11 data pages so it will be discussed about the first data page. The first digital data page of the Lenna picture is figure 4. And on figure 5, there are cluster centers found by the two clustering algorithms about the first data page – subtractive clustering and fuzzy C-maen clustering. The blue x markers are cluster centers found by subtractive clustering algorithm and red o markers are found by C-mean clustering algorithm.
ٻ Fig.4 The first data page
ٻ Fig. 5 Cluster centers found by the two clustering algorithms The main objects are small errors of data page and short process time taken by each clustering algorithm. For these objects parameter values are selected and simulated. About the cluster centers found, intensities of pixels by a specific range are decreased by 0.2. The ranges are different about clustering algorithms, 4 about subtractive clustering and 9 about C-mean clustering. Figure 6 is the first data page with artificial IPI noise made by 2-dimensional Fourier Transform.
Figure 7 is the first data page modified with subtractive clustering algorithm and figure 8 is modified with C-mean clustering algorithm.
ٻ ٻ
Fig.6 The first data page with artificial IPI noise
ٻ Fig.7 Data page modified with subclustering
ICCAS2005 June 2-5, KINTEX, Gyeonggi-Do, Korea
ٻ Fig.8 Data page modified with C-mean clustering Apply the error reduction process to all data pages and reconstruct the picture. Figure 9 is reconstructed picture modified with subtractive clustering and figure 10 is with C-mean clustering.
ٻ Fig.9 Reconstructed picture using subtractive clustering
ٻ Fig.10 Reconstructed picture using C-mean clustering Number of error pixels of figure 9 is 67 and it takes 123.31 time in arbitrary unit. About figure 10 number of error pixels is 75 and 100.5 time consumed.
When using subtractive clustering algorithm, number of error pixels is less than the case of using C-mean clustering algorithm but it takes more time about 1.25 times.
4. CONCLUSIONS
Inter Pixel Interference is one of a main noise sources in holographic data storage system. And it is required that making the intensity profile of data page to be as uniform as possible. By using clustering algorithm, clusters of on-pixels were found and intensities were decreased by a specific value. It was verified that number of error pixel was decreased through this procedure from simulation results.
It takes a time to proceed that, the algorithm which consumes less time is better. Therefore two clustering algorithms were simulated, subtractive clustering and C-mean clustering algorithm. Number of error pixels was smaller in subtractive clustering than C-mean clustering case but process time was longer. However the data page to be stored should be changed and each data page has its own characteristics, so subtractive clustering algorithm is better than C-mean clustering algorithm.
ACKNOWLEDGMENTS
This research was supported by the MOCIE (Ministry of Commerce, Industry and Energy) of Korea through the program for the Next Generation Ultra-High Density Storage (00008145) and the Korea Science and Engineering Foundation (KOSEF) through the Center for Information Storage Device (CISD) Grant No. R11-1997-042-11002-0.
REFERENCES
[1] Hans J.Coufal, Demetri Psaltis and Glen T. Sincerbox, Holographic Data Storage, Springer, 2000.
[2] Rafael C. Gonzalez and Richard E. Woods, Digital Image Processing, Prentice Hall, New Jersey, 2002. [3] ChangYong Yoon, JungHo Park and Mignon Park,
“Face recognition Wavelets and Fuzzy C-Means clustering,” Proceedings of the IEEK Conference, pp. 583-586, 1999.
[4] Muriel Bowie, “Fuzzy Clustering, Feature Delection, and Membership Function Optimization”, Department of Informatics University of Fribourg, Switzerland, Seminar Paper 2004.
[5] Min-Soo Kim and Seong-Gon Kong, “Fuzzy Control System Design by Data Clustering in the Input-Output Subspaces” Journal of the Korean Institute of Telematics and Electronics, Von. 34S, No. 012, pp.30-40, 1997.